Home
»
Fishbone Diagram
» Fishbone Analysis
Struggling to Complete a Fishbone Analysis?
Getting from Five Why's to the Root Cause Can be Time Consuming
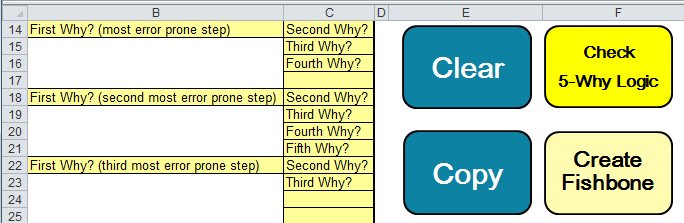
Just type in your 5 Why's and then click on the Create Fishbone button.
QI Macros will create a fishbone diagram in seconds.
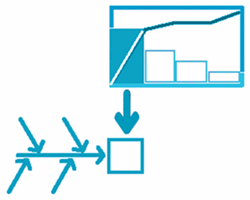
Here's a step by step on how to analyze root causes using a Fishbone Diagram:
- Define the Problem Statement.
Your problem statement comes from the big bar on your
Pareto chart.
Put it in the head of the fish and put major causes at the end of the major bones.
Major causes might include:
- Processes, machines, materials, measurement, people, environment
- Steps of a process (step 1, step 2, etc.)
- Whatever makes sense
- Ask 5 Whys. Begin with the most likely main cause and for each cause, ask "5 Whys."
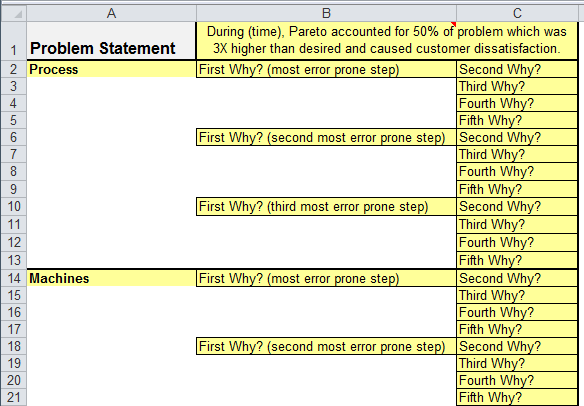
- Find the Root Cause(s): Circle one-to-five ROOT causes (at the end of the "5 whys" chain.)
- Verify your logic by reversing your 5 Whys questions.

Stop Struggling with Fishbone Diagrams!
Start creating your Fishbone Diagrams in just minutes.
QI Macros Draws These Charts Too!