Need to Create a Love Bug Diagram but Don't Know How?
QI Macros has a Ready Made Love Bug Template in Excel!
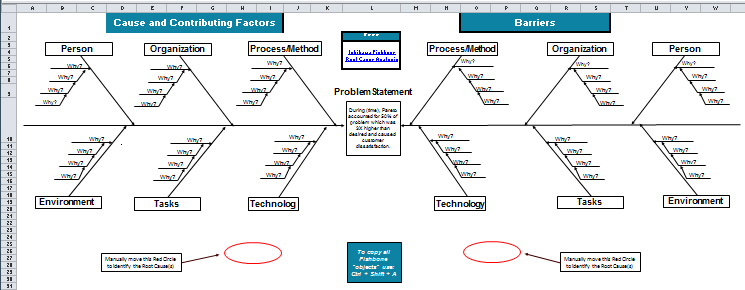
Use a love bug diagram to identify factors that contribute to an event, incident or defect and those that work to prevent them.
The Love Bug diagram combines two fishbone diagrams. The fishbone on the left documents factors that cause or contribute to an event. The fishbone on the right documents factors that work to prevent an event from occurring.
To access QI Macros Love Bug Diagram, click on QI Macros menu > Improvement Tools > Ishikawa Fishbone Diagram.
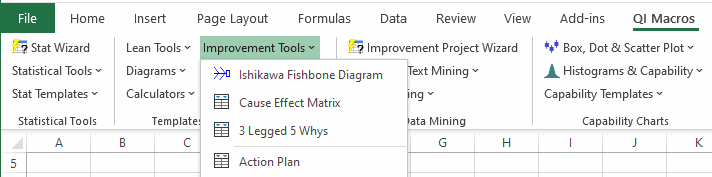
Once the Fishbone template is open, select the "Love Bug Diagram" tab at the bottom of the spreadsheet:

Analyze root causes like you would for a fishbone diagram.
- Put the problem statement in the head of the fish and the major causes at the end of the major bones. Major causes include:
- Processes, machines, materials, measurement, people, environment
- Steps of a process (step 1, step 2, etc.)
- Whatever makes sense
- Begin with the most likely main cause.
- For each cause, ask "5 Whys."
- Circle one-to-five ROOT causes (end of the "5 whys" chain).
- Verify the root causes with data (Pareto chart or Scatter Diagram).

Stop Struggling with Love Bug Diagrams!
Start creating your Love Bug Diagrams in just minutes.
Download a free 30-day trial. Get Love Bug Diagrams now!
QI Macros Draws These Charts Too!
