Need to Create a Time Value Map but Don't Know How?
QI Macros has a Ready-Made Time Value Map Template for Excel!
Why it Matters: Use Time Value Maps to analyze value-added and non-value-added activities and delays.
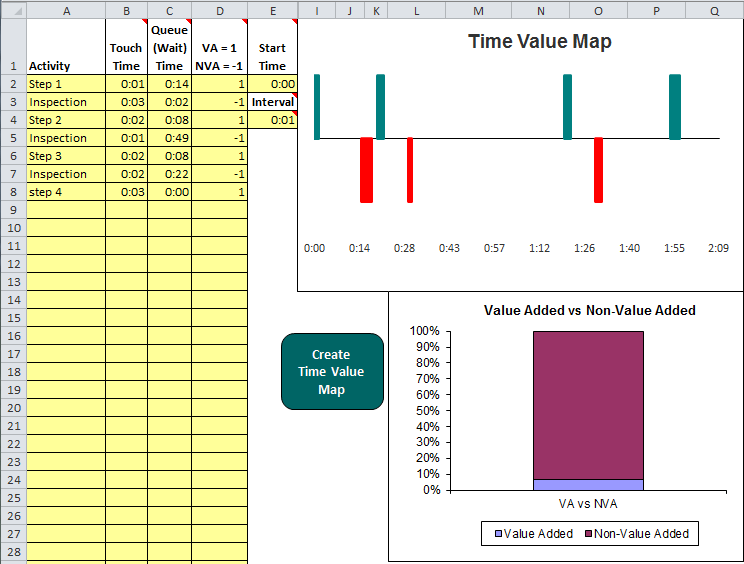
Example of the Time Value Map template in QI Macros for Excel
Any bar above the center line is value added (VA). Any bar below the center line is non-value added (NVA). The gaps between bars represent delay and are assumed to be non-value added. These can be eliminated with value stream mapping and spaghetti diagramming.
To create a Time Value Map in QI Macros:
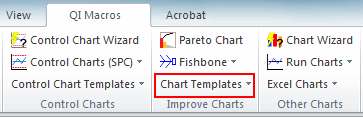
- Click on QI Macros » Lean Tools » Time Value Map to open the template.
- Column A: Enter the list of activities.
- Column B: Enter the duration for the activity described in column A.
- Column C: Enter the wait time (delay) between the steps.
- Column D: Enter whether the activity is value added (1) or non value added (-1).
- Column E:
- Enter the Start Time in E2 (e.g. 12:00:00 AM).
- Enter the interval in E4 (e.g., 0:01 or 0:05 minutes). The interval affects how the bars are drawn on the chart. If you have wide time spans, a bigger interval might work better. The lower the interval, the wider the bars. If you aren't sure what to enter just use the default.
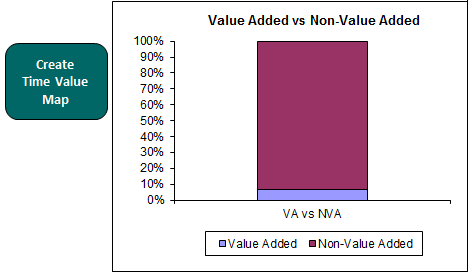
- Click the Create Time Value Map button. This will populate the time value map and also create a stacked bar chart comparing value added and non value added total elapsed time.
* NOTE: If not all of your data has been plotted on your Time Value Map, make sure you do not have more than 4,000 rows of data that is being created for calculation (e.g. an action or actions that span multiple hours, while your Interval is set at 0:01 minute, etc.).
Watch a Video of How to Create Time Value Map (Click Here)
Read more - Time Value Map of an Ultrasound Process
Popular Lean Tools in the QI Macros
Haven't you waited long enough?
Start creating your Time Value Map in just minutes.
Download a free 30-day trial. Get the Time Value Map now!
The Time Value Map is one of many charts and tools included in QI Macros add-in for Excel.
QI Macros adds a new tab to Excel's menu, making it easy to find and open any chart template you need.