Excel's Data Analysis Functions and Features
How to Articles with Step by Step Explanations and Screen Shots
Take Advantage of these Free Videos and Articles to Increase Your Excel IQ
Data Organization
Data Presentation Tips
- Chart Junk
- Data Display Tips Using Airline Quality Data
- Dunce Charts - Are You Still Using Line, Bar and Pie Charts?
- Format Charts - Tips for Formatting Charts
- Save and Reuse Custom Chart Formats
- Graphical Excellence
- Say It With Charts
- Visual Presentation of Data
- Use Excel to Create an Improvement Story
- Tips for Using Excel and Powerpoint for Presentations
- Time Tracking with Excel to Reduce Cycle Time such as Patient Length of Stay (LOS)
Features and Functions
- Excel's Autofilter Function
- Excel's COUNTIF Function to Count Words in Text
- Excel's Custom Fill Series
- Excel's Customize Ribbon to Format Cells
- Excel's Data Validation Functions and Features
- Excel's Data Validation Function to Gather Defect Data
- Excel's Find and Replace function to remove zeros from a worksheet
- Excel Formula to Convert Date and Time Format to Decimal Numbers
- Excel's Tables -Running Charts on Data in Tables
- Excel's Text to Columns and Concatenate Functions to Separate and Combine Data into cells
- Excel's VLookup or Offset and Match Functions to Merge Worksheets
- Hacking Excel's RANK Function
Excel PivotTable Tutorials
Statistical Tools in Excel
Stop using old technology!
Upgrade Your Excel and Data Analysis Skills to Smart Charts Using QI Macros.
Track Data Over Time
Primitive Chart
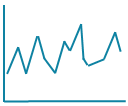
Line Graph
Line Graph
Smart Chart
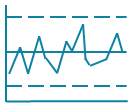
Control Chart
Control Chart
Compare Categories
Primitive Chart
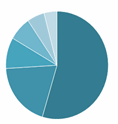
Pie Chart
Pie Chart
Smart Chart

Pareto Chart
Pareto Chart
Analyze Variation
Primitive Chart
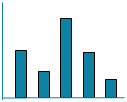
Bar or Column Chart
Bar or Column Chart
Smart Chart
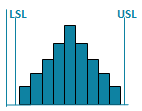
Histogram
Histogram
QI Macros add-in for Excel makes creating smart charts a snap.
Join 100,000+ Users
in 80 Countries


KnowWare International, Inc.
2696 S. Colorado Blvd., Ste. 555
Denver, CO 80222 USA
Toll-Free: 1-888-468-1537
Local: (303) 756-9144
©
1997 - 2026 KnowWare International Inc. All Rights Reserved. Legal Info | Terms of Use