Excel's Autofilter Function
Many QI Macros customers find themselves faced with huge data dumps from corporate systems. And they wonder: "What do I do with this?" Sometimes the first step is to reduce the data to a manageable quantity using Excel's Autofilter.
Create Subsets of Your Data Using Autofilter
Getting data out of corporate systems into Excel is usually easy. Virtually all allow some sort of export to Excel. Then comes the hard part: reducing the data. A data dump might look like this: (If you have loaded QI Macros or a 30 day evaluation copy, this spreadsheet is on your computer at c:\qimacros\testdata\crosstab.xls.)
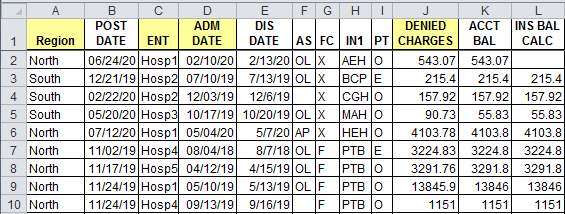
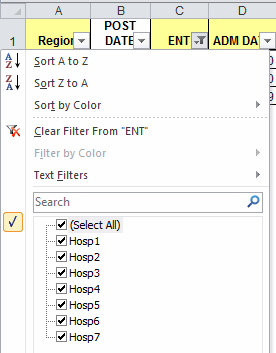
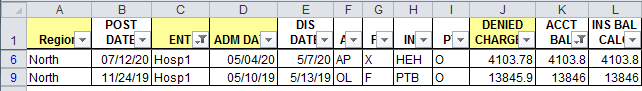
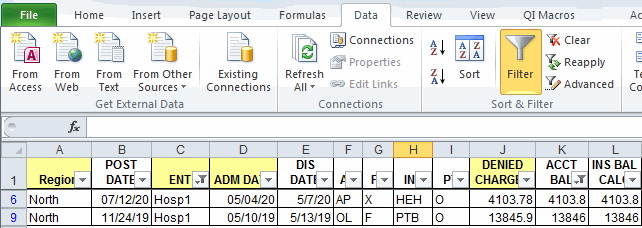
But maybe we only want to look at Hospital 1. You can use Excel's Filter function to reduce the data displayed. Click on Data > Filter. Then click on the pull down arrow next to ENT and only select the box next to Hosp 1:

This will select only the data that contains "Hosp1":

To remove the selection, simply click on the pull down menu and Select All:
Custom Autofilters
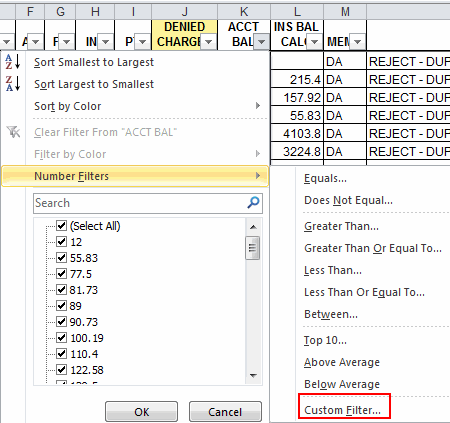
Or you might want do a custom selection. Let's say that we only want to see the patient accounts that have a unpaid balance of more than $2,000. To do this, click on the pull down arrow next to ACCT BAL and select Custom:
This opens a dialog window. Change the selection to "is greater than or equal to" and set the value to 2000:
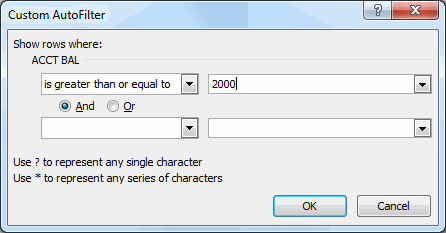
Then click OK to see the data the balances over $2,000:
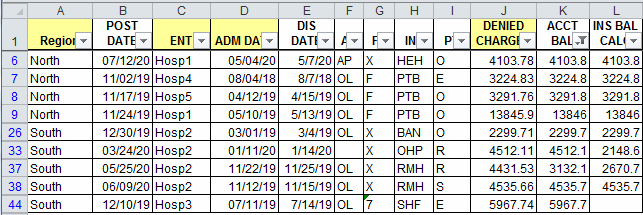
If you only want to see the balances for hospital 1 that are over $2,000, click on ENT and select Hosp1:
As you can see, you can continue to select and subset the data in any way you choose. You can copy and paste these subsets into another spreadsheet without any of the hidden rows using Edit-Copy/Paste. You cannot, however, paste data back into the autofiltered sheet without overwriting hidden rows.
If you get lost and want to start over, simply click on Data and then Filter to show everything.
Even Huge Spreadsheets Can Be Manageable
Excel's Autofilter can help reduce the amount of data served up by corporate systems to a manageable level. From there, you can:
- Use QI Macros to graph the selected data.
- Use Excel's PivotTable to summarize the selected data.
Use the power of Excel to narrow your focus to the few key things you want to understand, diagnose or improve. Then use QI Macros to graph the results and present your business case (i.e., improvement story) to the decision makers.
Stop using old technology!
Upgrade Your Excel and Data Analysis Skills to Smart Charts Using QI Macros.
Track Data Over Time
Line Graph
Control Chart
Compare Categories
Pie Chart
Pareto Chart
Analyze Variation
Bar or Column Chart
Histogram
QI Macros add-in for Excel makes creating smart charts a snap.
Join 100,000+ Users
in 80 Countries

