Tips for Using Excel And PowerPoint for Presentations
People often use PowerPoint to show their Six Sigma improvement projects. While this can be done, it may not be the easiest way to do it. And, customers have found that there are glitches in the PowerPoint-Excel interface that can cause problems.
Embedding Excel Charts in PowerPoint
If you are going to use Excel charts in PowerPoint (PPT), there are three main ways to do it:
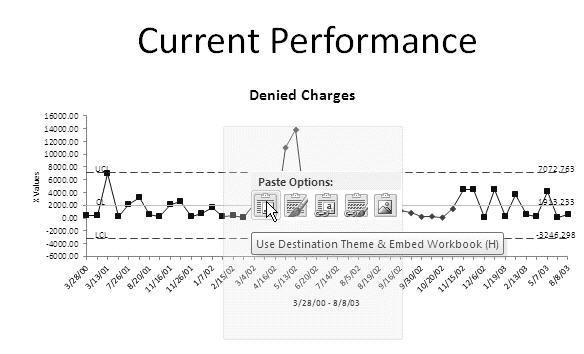
Embed the Chart
You can open the Excel workbook from PowerPoint, but changes stay within PowerPoint.
File size grows with each Excel workbook.
 )
)
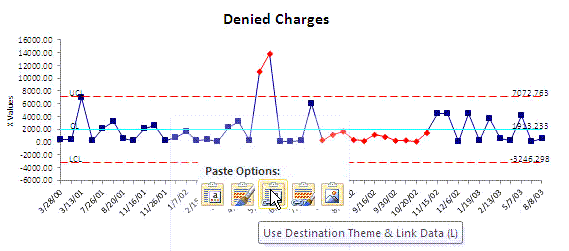
Embed a Link to an Excel File Containing a Chart
You can change the Excel file and update the presentation when you open in PowerPoint.
It takes longer for PowerPoint to open all of the links. And too many links may cause problems.
Paste the Chart as a Picture
No messy links to Excel and minimal increase in file size.
You can't update the chart
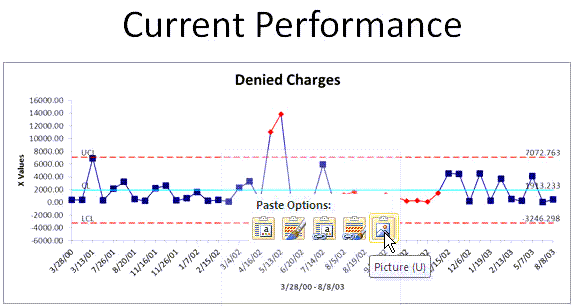
For a one-time presentation, pasting a picture of the Excel chart is the best choice.
For weekly or monthly reporting, embedding a link seems like the best option, but we have found that there are limits to how many links PowerPoint will tolerate. When you exceed those limits, PowerPoint either crashes or freezes. If this happens, split the presentation into two or more parts.
Using Excel for Presentations
When someone says "presentation" everyone automatically thinks PowerPoint, but PowerPoint is not your only choice. If your presentation or improvement project contains several Excel charts or tables, it may be easier to use Excel for the presentation rather than going through all of the extra work of putting the charts into PowerPoint.
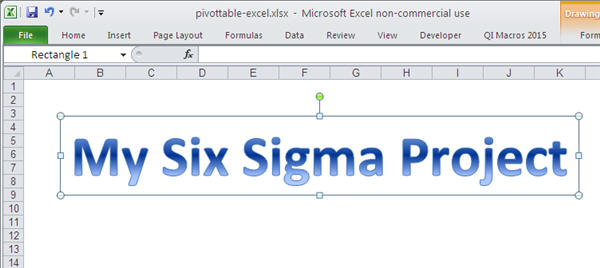
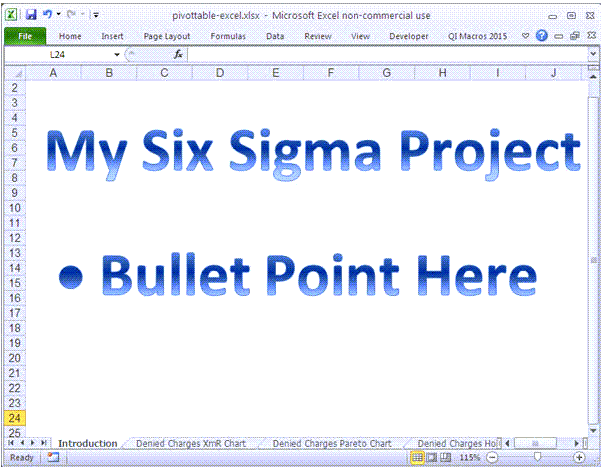
Creating Title Pages in Excel
To create a title or bullet point page from a blank worksheet, select the View tab on Excel's menu and then uncheck the box next to Gridlines.
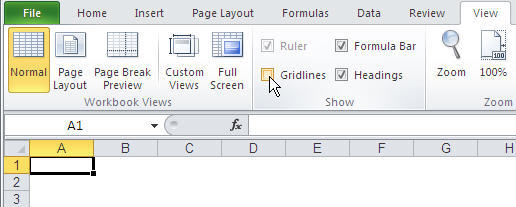
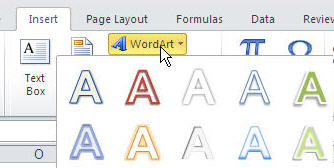
Insert WordArt to create a Title.
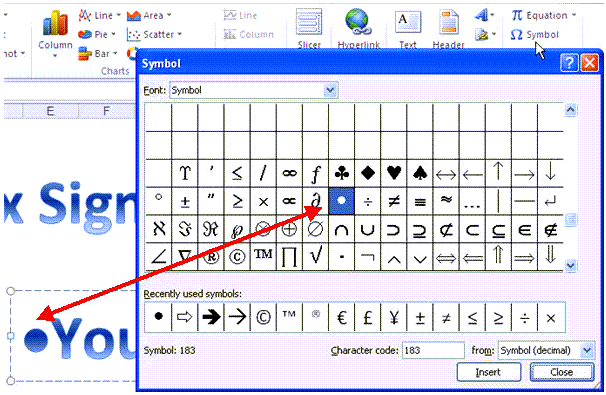
You can also use Insert-Symbol to create bullet points.
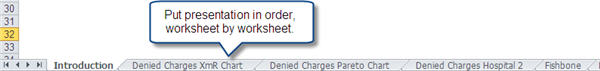
Sequencing the Presentation
Excel workbooks consist of one or more worksheets. You can reorder these by clicking and dragging each worksheet around to get them in the order you want for your presentation.
Giving the Presentation
Click on each subsequent worksheet or use CTRL-PageDown to scroll through the presentation.
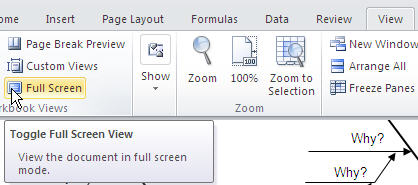
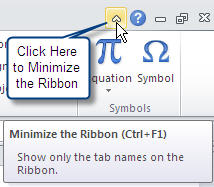
Tip: if you use Excel's Full Screen Option or hide Excel's Ribbon Menu, the presentation will look better.
An Improvement Project Presentation
An improvement project presentation given in Excel might look like the following:

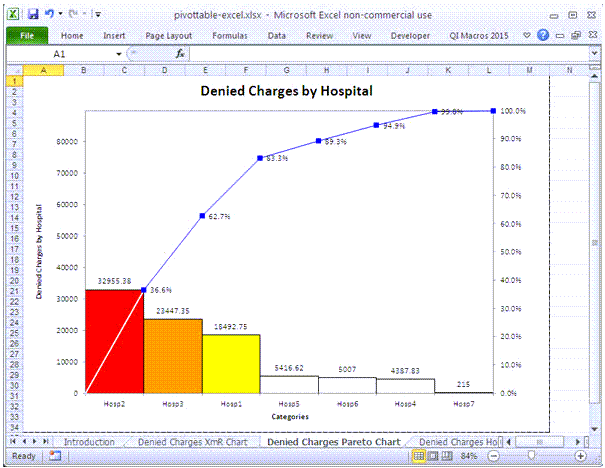
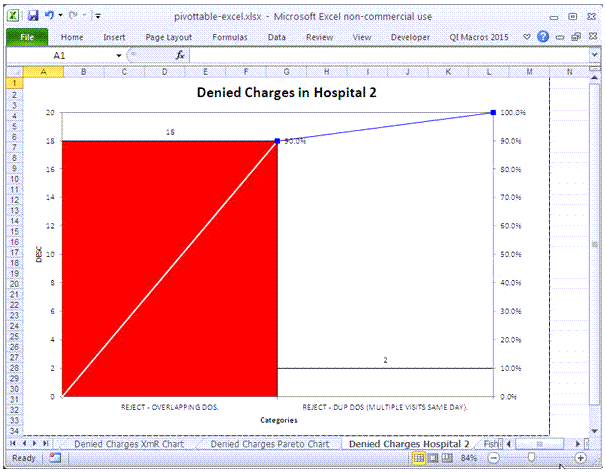
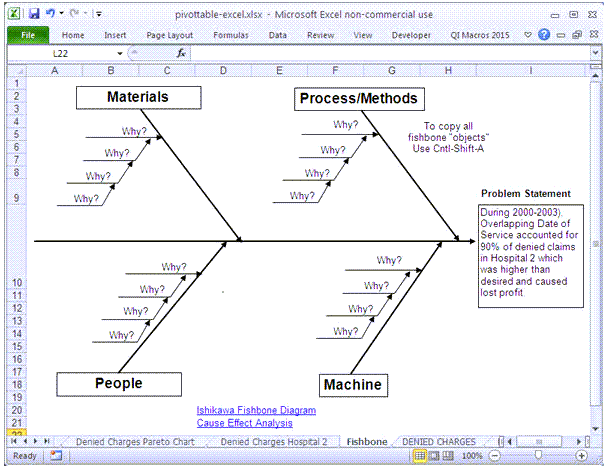
Get the Idea?
Excel can serve as your presentation tool as well as your data analysis tool. Why not put everything you need in Excel and skip the extra work of copying and pasting the charts and data into PowerPoint? Save yourself some time and hassle. Use Excel for Six Sigma project and monthly reporting instead of PowerPoint.
Other Charts Included in QI Macros for Excel
Join 100,000+ Users
in 80 Countries

