Convert Time Format to Decimal Range
Case Study - Time to Hour Span for Pareto Chart
One hospital operating room was trying to determine how long it takes from the time a patient arrives until they enter the OR. They had the actual times, so they could have run a histogram using QI Macros, but wanted to categorize it as 0-1 hour, 1-2 hours, and so on.
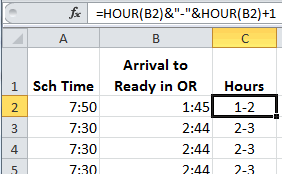
The formula to convert time to an hour-span involves concatenating the hour with a dash (-) and some addition. So, 2 hours and 44 minutes (2:44) becomes 2-3.
Here's the Excel Formula to Convert Time to a Decimal Range:
=HOUR(B2)&"-"&HOUR(B2)+1
View in Excel:
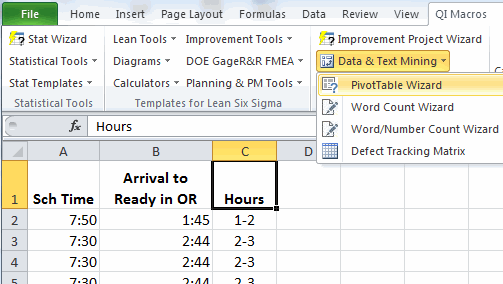
Once Completed, Use a PivotTable to Summarize the Data:
- Click on Cell C1 and use the QI Macros PivotTable Wizard to summarize the data:
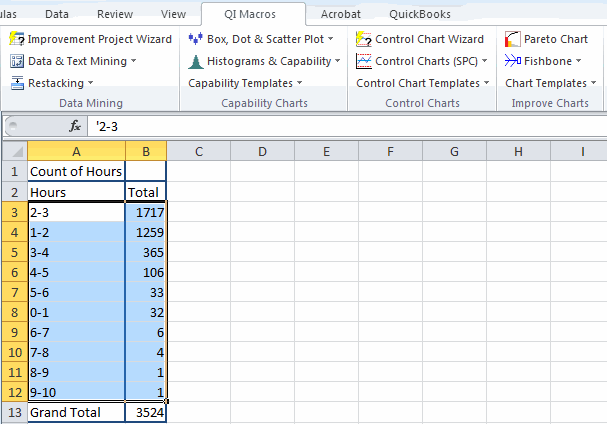
- In the pivot table, click and drag over A3 to B12 and then click the QI Macros menu and then Pareto Chart.
- Analyze the Pareto Chart for what it tells you.
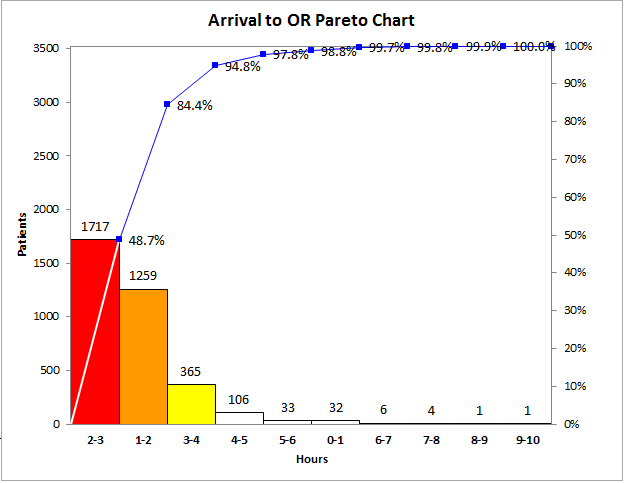
Analyzing the Data
Based on my experience, I’d guess that patients in the 0-1 hour category probably came from the emergency room. Almost half, however, take 2-3 hours from arrival to the OR. If you've ever been a surgical patient, you know that the time spent waiting for surgery is like dog years - every minute seems like 10. From a patient standpoint, wouldn’t the hospital want to reduce all times from arrival to OR?
Learn More:
Stop using old technology!
Upgrade Your Excel and Data Analysis Skills to Smart Charts Using QI Macros.
Track Data Over Time
Line Graph
Control Chart
Compare Categories
Pie Chart
Pareto Chart
Analyze Variation
Bar or Column Chart
Histogram
QI Macros add-in for Excel makes creating smart charts a snap.
Join 100,000+ Users
in 80 Countries

