Save Time Customizing Excel Formats
Learn How to Save and Reuse Custom Chart Formats in Excel
Several customers have said: I'd like to use a different format for some of the charts I produce. I don't want to have to redo it all manually every time. GOOD NEWS!
- QI Macros have this feature built into our Chart menu under Remember and Apply Chart Formats
- If you don't have QI Macros, but have Excel 2007 and later versions, you can save a chart format to a template and then apply it to any future chart.
Here's How to Save and Reuse a Chart Format
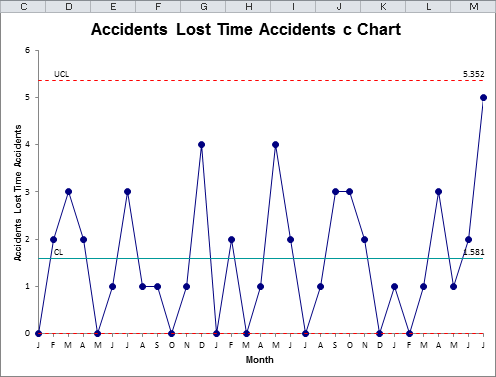
Once you've drawn a chart, you can change the formatting of the lines, fonts, colors, whatever you want. In this example, I've changed a c Chart to use Broadway font and other colors.

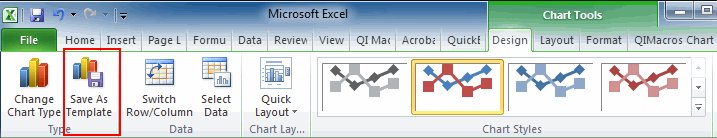
If I then click on Chart Tools - Design - Save as Template and give it a name like c Chart.ctrx, I can then access this format later.
Then I can reuse this template everytime I draw a c Chart.
Applying the Template to a New Chart
So, if I draw another c Chart...
And then click on Chart Tools - Design - Change Chart Type and select Templates-c Chart:
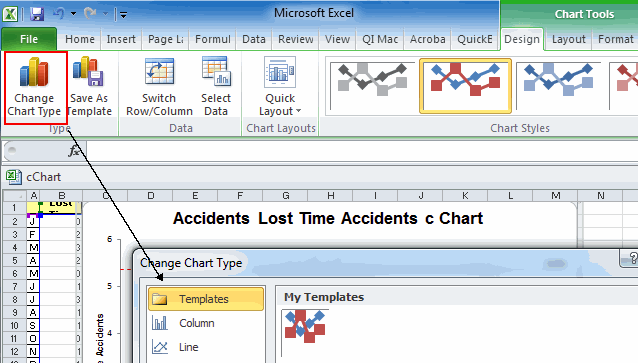
Excel will reapply all of the formating changes in the template:

Pretty slick huh?
Warnings: This should work for most of the charts except those that use Error Bars. QI Macros charts that use error bars are:
- XbarR, XbarS, XMedianR
- p and u charts
- Box and Whisker Plot
Workaround for QI Macros charts that use error bars:
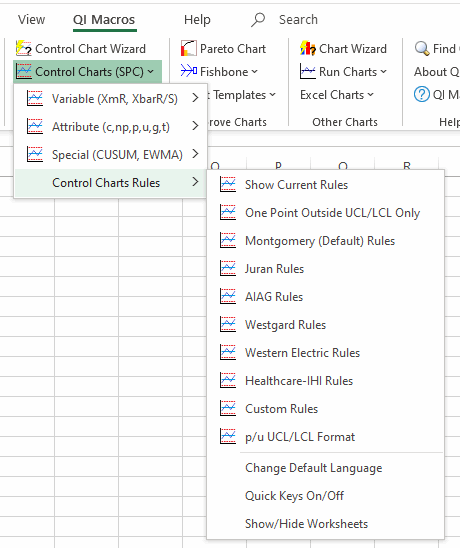
If you switch the control chart format to "Wave", the X, p and u charts will use normal formatting that can be modified by this technique. Click on Control Charts (SPC) -> Control Chart Rules -> p/u UCL/LCL Format to get the "Wave" format:
Tarpits: I found out the hard way that Excel will remember EVERYTHING about the chart format! It will remember red out-of-control points and lines on control charts and change those points red anytime you apply the format. So you might want to use QI Macros Chart Menu -> Clear Stability Analysis before saving the template.
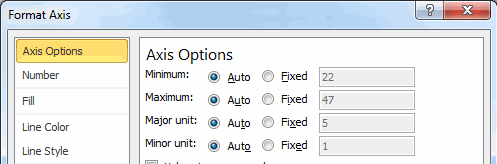
Also, make sure the axis options are set to auto, not a fixed value. Otherwise, when you apply the format your chart may vanish because the data is below the fixed limit (22.2):
Stop using old technology!
Upgrade Your Excel and Data Analysis Skills to Smart Charts Using QI Macros.
Track Data Over Time
Line Graph
Control Chart
Compare Categories
Pie Chart
Pareto Chart
Analyze Variation
Bar or Column Chart
Histogram
QI Macros add-in for Excel makes creating smart charts a snap.
Join 100,000+ Users
in 80 Countries

