Need Descriptive Statistics of Your Data?
QI Macros calculates descriptive statistics for you and more!
Descriptive Statistics Using QI Macros
- Select your Data
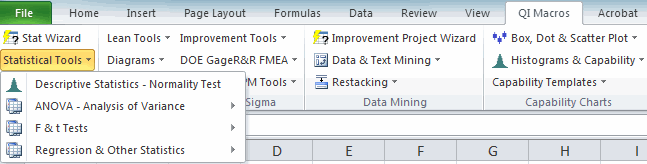
- Click on QI Macros Menu > Statistical Tools > Descriptive Statistics
- QI Macros will make the calculations and interpret the results for you.
QI Macros Descriptive Statistics
QI Macros descriptive statistics is much easier to use than Excel's data analysis toolpak AND it contains additional calculations and charts. Just click and drag over your data to select it, then click on QI Macros > Statistical Tools > Descriptive Statistics.
QI Macros output contains all of the descriptive statistics Excel provides plus:
- A data normality test (Anderson Darling Test) with results, Percentiles, and
- Charts: Histogram, Box Plot, Confidence Intervals, Tolerance Limits, and Normal Probability Plot:
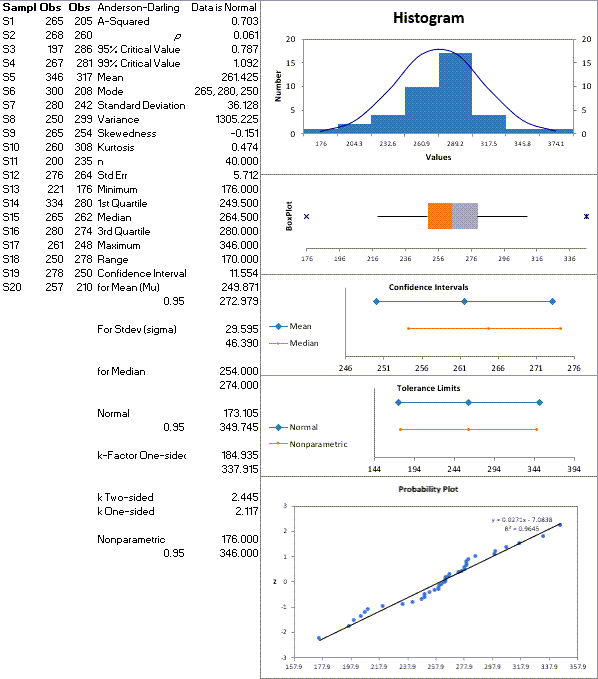
Normal Tolerance Limits: These limits assume that the data comes from a normal distribution and therefore uses the mean and standard deviation outputs to calculate.
Nonparametric Tolerance Limits: These limits represent intervals that do not assume any specific distribution for the data. Use this approach when your data is non-normal or you do not know if the data is normally distributed.
Excel's Descriptive Statistics
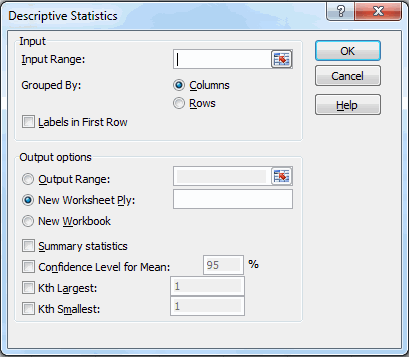
Excel can calculate some descriptive statistics for your data, but its interfaces are difficult to understand. In Excel click on Tools, Data Analysis and Descriptive Statistics to get this input window:
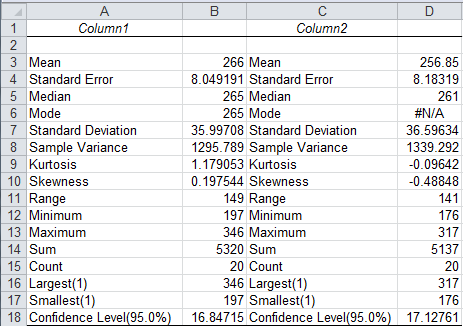
Excel calculates a separate set of statistics for each column or row of your data. If you want to calculate statistics for all of your data, make sure your data is only in one row or column. Excel's output looks like this:
Excel's Function Key
You can use Excel's function key (fx) to calculate some statistics:
However, you may have to perform some preliminary calculations on your own and set up inputs of the calculation in a spreadsheet. For example, if you wanted to calculate confidence intervals for a set of data you would need to perform the following steps:

Save yourself time and frustration, use QI Macros for your statistical needs.
