Need to Run a Spearman Rank Correlation Coefficient Test in Excel?
QI Macros has a Ready-Made Spearman Rank Template for you!
When to Use the Spearman Rank Correlation Coefficient
A Spearman correlation test assesses the ranks of two sets of data rather than the data itself as Excel's correlation function does.
Spearman Test Example Using QI Macros Template
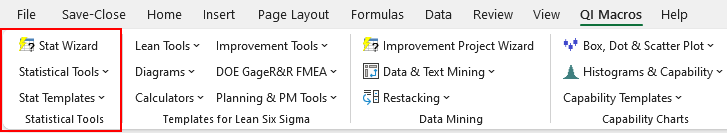
- To open the template, click on the QI Macros menu and select Stat Templates > Spearman
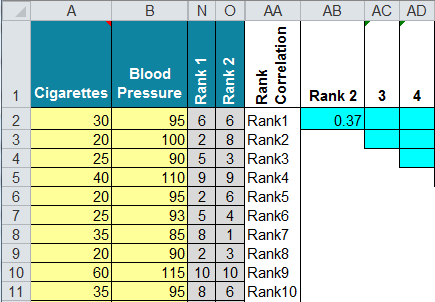
- Input your data into the yellow shaded areas in columns A:M.
- QI Macros template performs the calculations for you in columns N:AM.
Comparing the number of cigarettes smoked by 10 smokers (column A) and their diastolic blood pressure (Column B) gives these results.
Interpreting the Results of the Spearman Correlation Coefficient Test
Since the correlation (0.367) isn't 0.80 or greater, we cannot conclude there is a correlation between smoking and hypertension in these ten smokers.
Note: In the example, above we have hidden the unused columns. Never delete rows or columns in QI Macros templates as you may accidentally break formulas.
Haven't you waited long enough?
Start running Spearman rank tests in just minutes.
Download a free 30-day trial. Run Spearman rank tests on your data now!
Spearman rank tests are one of many statistical tests included in QI Macros add-in for Excel.
QI Macros adds a new tab to Excel's menu, making it easy to find any tool you need. You will find the statistical tools and templates on the far left side of QI Macros menu.