Need to Run a Test of Two Proportions in Excel?
QI Macros has a Ready-Made Two Proportions Test Template
Use our Two Proportion test template to compute a confidence interval and perform a hypothesis test of the difference between two proportions.
Test of Two Proportions Example Using QI Macros Template:
In this example, you are sending a direct mail piece to a group of prospects and want to know if the proportion of customers who respond could be increased by offering free shipping. You would offer free shipping on half of your mailings and see if you have more purchases from the group that was offered free shipping from the group that was not.
- Conduct your test and use a PivotTable to summarize the trials and successes
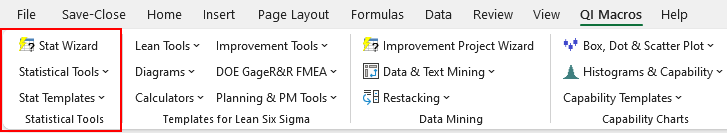
- Click on QI Macros menu > Stat Templates > 1-2 Proportion tests. A template will open. Click on the tab labeled "Two Proportions."
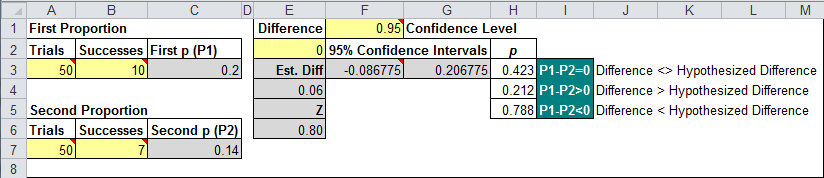
- Enter Test Difference in E2. The default is 0.
- Enter number of trials in A3 and A7
- Enter number of successes in B3 and B7
- Enter confidence Level in F1
- Null hypothesis is H0: P1=P2, H1: P1<>P2
If cell I3:I5 is green, you cannot reject the null hypothesis (accept the null hypothesis)
If cell I3:I5 is red, reject the null hypothesis.
QI Macros also contains a Test of One Proportion template
Haven't you waited long enough?
Start running Test of Two Proportions in just minutes.
Download a free 30-day trial. Run Test of Two Proportions on your data now!
Test of Two Proportions are one of many statistical tests included in QI Macros add-in for Excel.
QI Macros adds a new tab to Excel's menu, making it easy to find any tool you need. You will find the statistical tools and templates on the far left side of QI Macros menu.