Want to Run an ANCOVA Test in Excel?
QI Macros has a ready-made ANCOVA template for you!
What is ANCOVA?
Analysis of Covariance (ANCOVA) is a combination of ANOVA and regression. ANCOVA is used to compare means of an outcome variable between two or more groups taking into account (or to correct for) variability of other variables, called covariates (CV). ANCOVA compares the adjusted means of two or more independent groups.
In short, ANCOVA looks at the influence of two or more independent variables on a dependent variable, while removing the effect of the covariate factor.
Listen to our ANCOVA podcast below!
* Generated using QI Macros' source material via an AI model *
Example of QI Macros ANCOVA Template in Excel
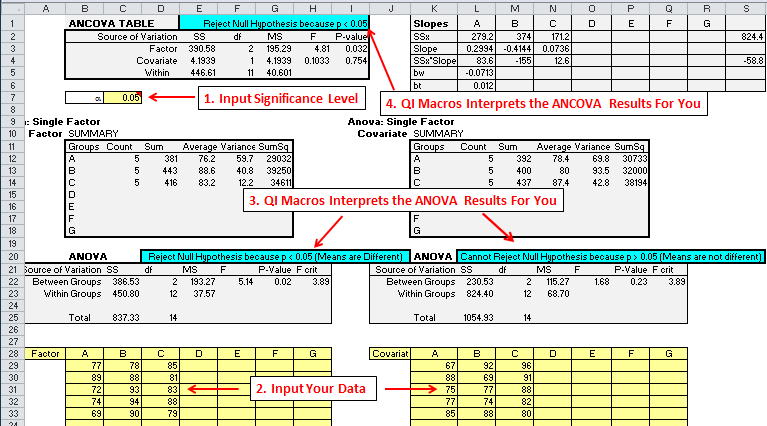
Just input your significance level and data and QI Macros does the rest!
QI Macros interprets the results for you!
QI Macros not only makes all of the calculations but its built in code is smart enough to tell you:
- If you can Reject Null Hypothesis or Cannot Reject Null Hypothesis.
- If the Means are Different or the Means are not different.
Haven't you waited long enough?
Start running ANCOVA tests in just minutes.
Download a free 30-day trial. Run ANCOVA tests on your data now!
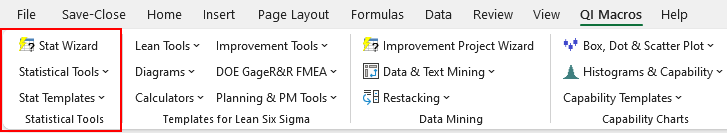
ANCOVA tests are one of many statistical tests included in QI Macros add-in for Excel.
QI Macros adds a new tab to Excel's menu, making it easy to find any tool you need. You will find the statistical tools and templates on the far left side of QI Macros menu.