What's the Difference Between R Squared and Adjusted R Squared?
QI Macros Regression Analysis Calculates Both for You!
Run Regression Analysis using QI Macros
- Select your data.
- Click on QI Macros menu > Statistical Tools > Regression.
- QI Macros will do the math and analysis for you.
Regression Analysis: R Squared versus Adjusted R Squared
Regression analysis evaluates the effects of one or more independent variables on a single dependent variable. Regression arrives at an equation to predict performance based on each of the inputs.
The R Squared and Adjusted R Squared values give the goodness of fit. Anything over 0.80 (80%) is considered a good fit.
R Squared can be biased. So, Adjusted R Squared tweaks the R Squared based on degrees of freedom.
Example of QI Macros Regression Analysis Results
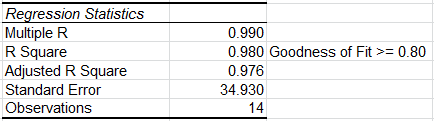
Analysis: If R Squared is greater than 0.80, as it is in this case, there is a good fit to the data. Some statistics references recommend using the Adjusted R Squared value.
In this example, R Squared of 0.980 means that 98% of the variation can be explained by the independent variables. Notice that the Adjusted R Squared (0.976) is less than R Squared (.980).
