Struggling to Run Two-Way ANOVA Without Replication in Excel?
QI Macros can run Two-way Anova for you AND interpret the results.
Run ANOVA Two-factor without replication using QI Macros:
- Select your data.
- Click on QI Macros menu > Statistical Tools > ANOVA > ANOVA Two Factor Without Replication
- QI Macros will do the math and analysis for you.
Two-Way ANOVA (Analysis of variance), can help you determine if two factors have the same "mean" or average.
What Makes QI Macros Statistical Add-in for Excel Unique?
- Works Right in Excel: point and click simple.
- Interprets the results for you: QI Macros built in code will tell you what the numbers mean.
- Draws a chart to help you visualize the comparison between data sets.
Example of QI Macros Two Way Anova Analysis Output
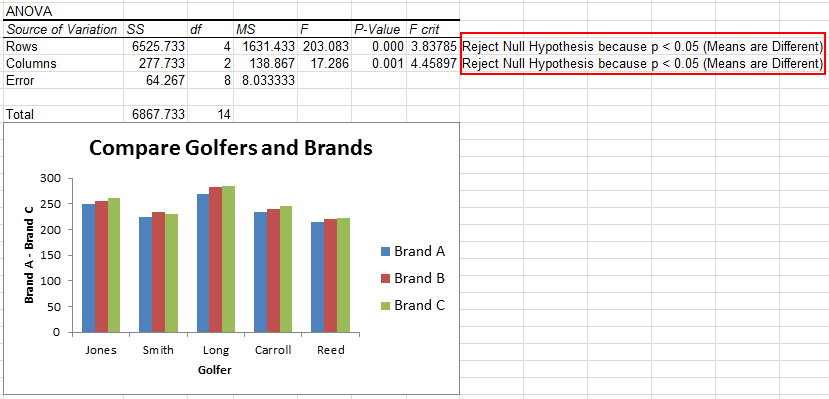
Two-Way ANOVA Analysis Without Replication Example
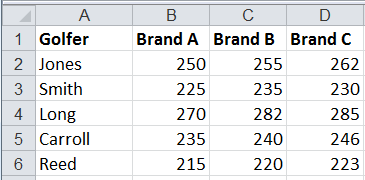
What if you want to know if there is a difference in driving distance between three brands of golf balls for different golfers? (From Advanced Statistics Demystified by Dr. Larry J. Stephens)
To perform a Two Way ANOVA test in Excel using QI Macros, just follow these steps:
- Click and drag over your data in Excel to select it:
- Click on QI Macros menu > Statistical Tools > ANOVA, and then select "ANOVA Two Factor Without Replication":
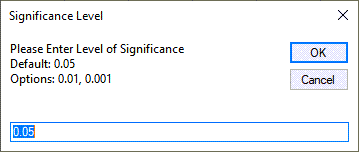
- QI Macros will prompt you for a significance level. Default is alpha=0.05 for a 95% confidence.
- QI Macros will perform all of the calculations and interpret the results for you.
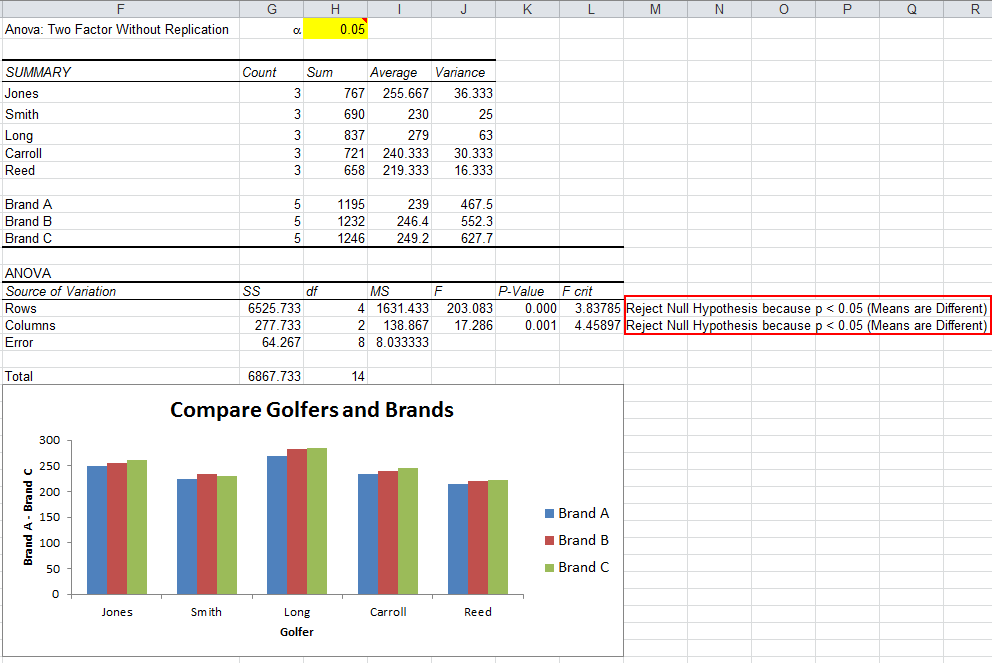

QI Macros built in code compares the p value to the significance level and provides this interpretation: Reject Null Hypothesis because p<0.05 (Means are Different/Means are not the Same).
Further Analysis of the Results
It does look like Brand B and C are similar. We could run a paired two sample t-Test on Brands B and C to determine if they deliver the same average distance.
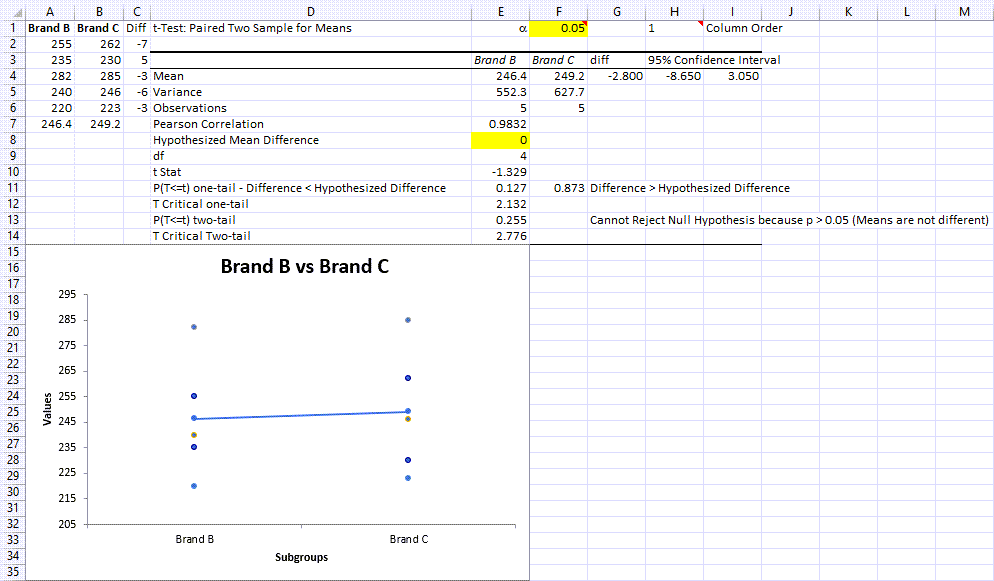
Since the p values are greater than alpha (0.05), we "Cannot Reject the Null Hypothesis (Accept the Null Hypothesis)." There seems to be no difference between the two brands of golf balls, except perhaps price.

