Trying to Run an Anderson Darling Normality Test in Excel?
QI Macros can conduct Anderson Darling tests for you!
To run an Anderson-Darling Normality Test using QI Macros:
- Select your data.
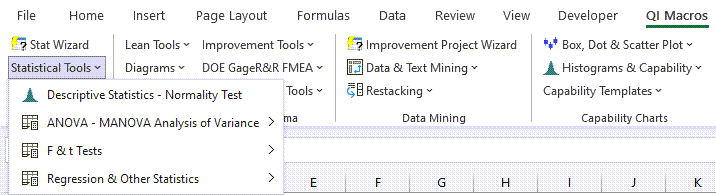
- Click on QI Macros menu > Statistical Tools > Descriptive Statistics
- QI Macros will do the math, draw the charts and analyze results for you.
Is Your Data Normal?
Statistical analysis, like ANOVA, may rely on your data being "normal" (i.e., bell-shaped). So how can you tell if your data is normal?
Anderson Darling p-value and Critical Value Method
QI Macros Anderson-Darling output includes the Anderson-Darling statistic, A-squared, and both a p-value and critical values for A-squared.
QI Macros adds this functionality.
To run a normality test using QI Macros:
- Select your data, then click on the QI Macros menu and select Statistical Tools > Descriptive Statistics - Normality Test:
- QI Macros will run an Anderson-Darling Normality Test and other descriptive statistics giving both numerical and graphical representations of the data:
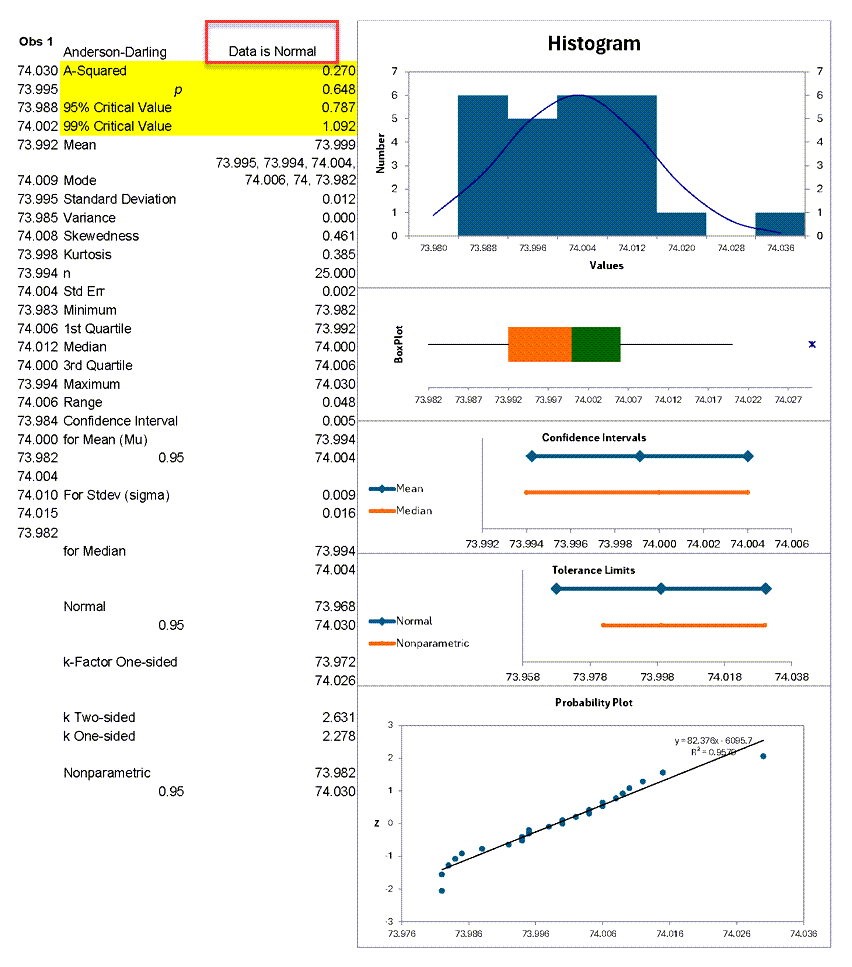
*Sample data located in the "XbarR.xlsx" file, using Column B (Obs 1) found in the "Practice" tab*
Interpreting the Anderson Darling Results
The Anderson-Darling values shown are:
- A-squared = 0.270
- p value= 0.648
- 95% Critical Value = 0.787
- 99% Critical Value = 1.092
If |
Then |
| p value <= a | Reject the null hypothesis |
| p value > a | Cannot reject the null hypothesis (accept null hypothesis) - the data is normal. |
| A-squared > critical value |
Reject the null hypothesis |
| A-squared <= critical value |
Cannot reject the null hypothesis - the data is normal. |
"Null hypothesis" is that the data is normal.
The "alternative hypothesis" is that the data is non-normal.
Reject the Null hypothesis (i.e., accept the alternative) when p<=alpha or A-squared>critical value.
Using the p value: p = 0.648 which is greater than alpha (level of significance) of 0.01. So we cannot reject the null hypothesis (accept the null hypothesis) (i.e., the data is normal).
Using the critical values, you would only reject this "null hypothesis" (i.e., data is non-normal) if A-squared is greater than either of the two critical values. Since 0.270 < 0.787 and 0.270 < 1.092, you can be at least 99% confident that the data is normal.
Another Example Using QI Macros Sample Data
Click on QI Macros Help menu and then "Open QI Macros Sample Data":

Open the XbarR data file and choose the tab labeled Practice. Now select cells D:1 to D:26 and then Statistical Tools > Descriptive Statistics - Normality Tests:
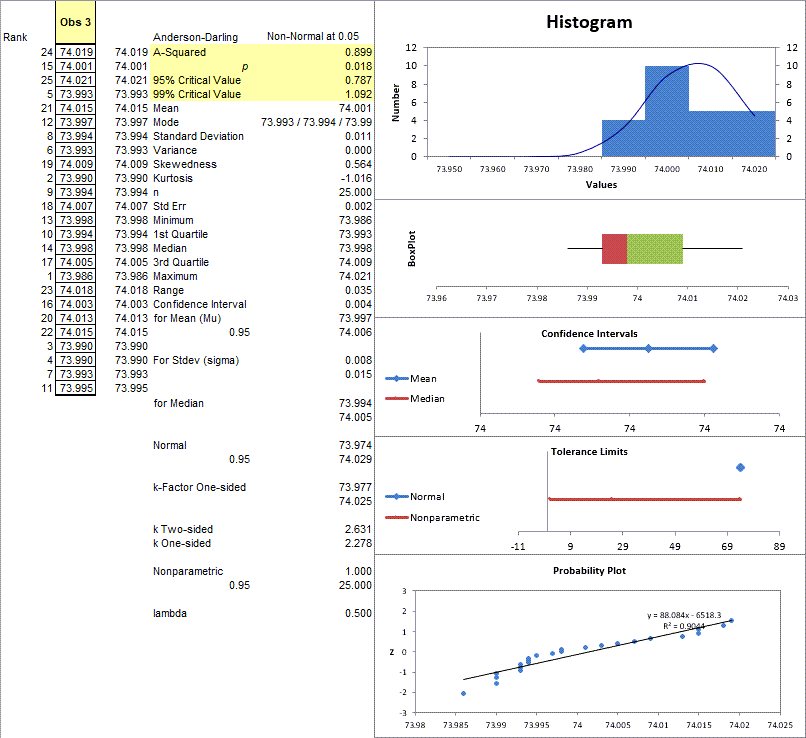
Notice how the normality plot curves at the right so that some of the points are farther from the line? Using Anderson-Darling we discover that the data is considered normal at one level (99%), but not at another (95%).
Using the p value p = 0.018 which is greater than alpha of 0.01 (0.01 < 0.018 < 0.05), we can reject the null hypothesis (i.e., the data is normal) at alpha = 0.05, but not at alpha = 0.01.
Using the critical values, . Since 0.787 < 0.899 < 1.092, you would reject the null hypothesis at 95% but not reject it at 99%.
Frankly, the double negatives of "not rejecting the null hypothesis" makes my brain tired. All I really want to know is: "Is my data normal?" So, in summary:
- If the dots fit the trend line on the normal probability plot, then the data is normal.
- If p > alpha, then the data is normal.
- If A-squared < Critical Value, then the data is normal.
Stop Struggling with Anderson-Darling Tests!
Start conducting Anderson-Darling Tests in just minutes.
Download a free 30-day trial. Run Anderson-Darling Tests now!
QI Macros Draws These Charts Too!
