Excel's Data Analysis Toolpak
Mistake Proof Your Statistical Tests Using QI Macros Add-in
Excel's Data Analysis Toolpak performs calculations for many statistical tests. However, there are a few issues to be aware of.
For example, when running an F-test or t-test, Excel's Data Analysis toolpak requires that the data set with the largest variance be defined as Variable 1. But how do you know until you run the test?
If you select the wrong data set as Variable 1, your results will be wrong!
QI Macros add-in has code that is smart enough to do this for you.
How do I Install the Data Analysis Toolpak in Excel?
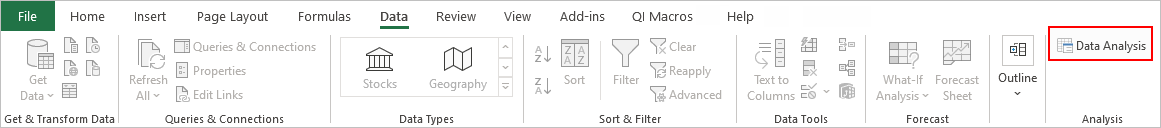
The Data Analysis Toolpak in Excel 2021-2024, Office 365 is on the far right of the main menu. If you don't see it there, then you need to install it.
To Install:
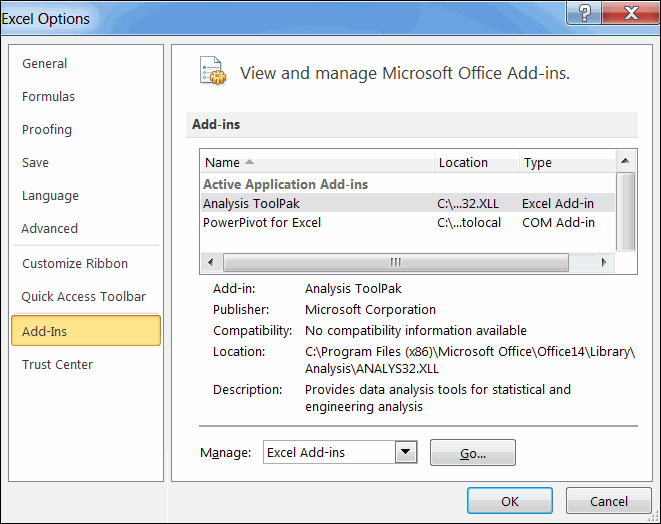
- Go to File-Excel Options-Addins and look for the Excel-Add-ins box at the bottom of the window. Click on the "Go" button.
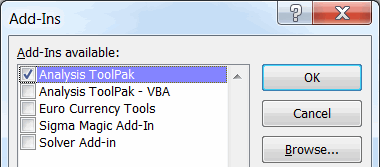
- Check the Analysis Toolpak box and select OK:
How do I Run a Statistical Test Using Excel's Data Analysis Toolpak?
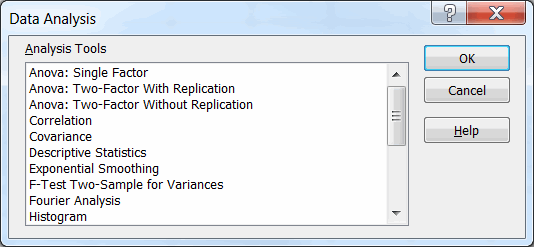
Click on Data Analysis and then on the statistical test you want to run.
An input window will open which you need to complete. Here's an example of the t test:
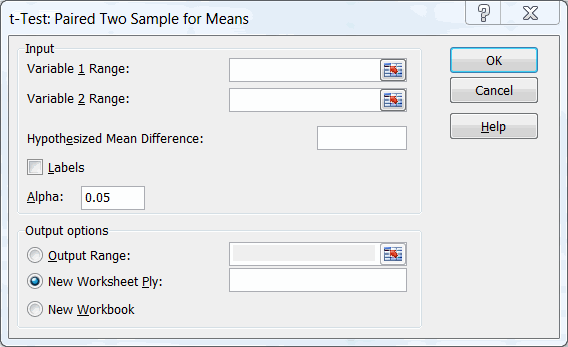
Warning:
Excel's Data Analysis toolpak requires that the data set with the largest variance be defined as Variable 1. If you select the wrong data set as Variable 1, your results will be wrong!
But how do you know until you run the test!
Three Reasons to Choose QI Macros Over Excel's Data Analysis Toolpak
1. QI Macros Mistake Proofs Your Calculations
QI Macros Add in for Excel contains code to analyze your data, organize it and perform calculations for statistical tests like the f test and t test accurately. No worrying about which data set is variance 1 versus variance 2.
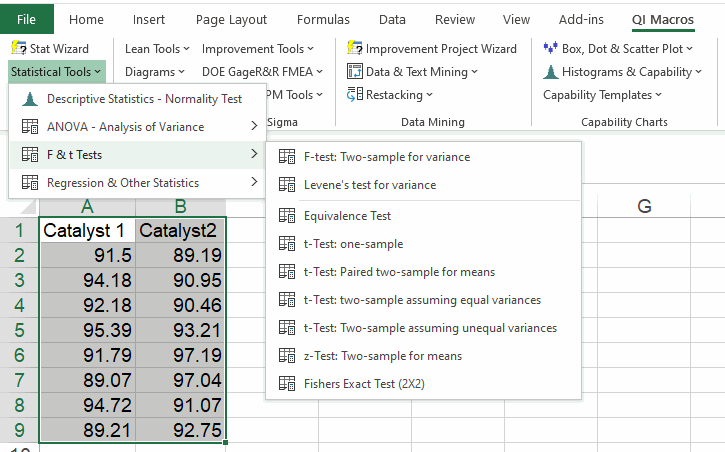
All you have to do is select your data, then click the Statistical test you want from QI Macros tab on Excel's menu. QI Macros will analyze the data, perform the calculations and interpret the results for you.
2. QI Macros Can Choose the Right Statistical Test for You
If you aren't sure which statistical test to run, QI Macros Statistics Wizard will run all of the possible tests on your data. Just select your data and select the Stat Wizard from QI Macros menu.
3. QI Macros Interprets the Results for You
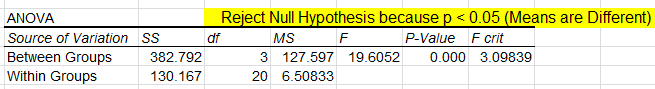
Unlike other statistical software, QI Macros is the only statistical software that compares the p-values to the significance level and tells you when to "Reject the Null Hypothesis or Cannot Reject the Null Hypothesis (Accept the Null Hypothesis)." QI Macros results also tell you: "Means are Different/Means are not the Same or Means are not Different/Means are the Same - or - Variances are Different/Variances are not the Same or Variances are not Different/Variances are the Same."
Learn More...
- Hypothesis testing
- List of Statistical Analysis Tests in QI Macros
