Looking for a Data Mining Case Study?
Learn how to analyze data using Excel text to columns and pivottables
I've been working with a hospital ICU unit that wants to explore the relationship between the use of various sedatives and delirium. Delirium occurs in 45-87 percent of patients; that's 4-8 out of every 10. While sedation can keep a waking patient from ripping out a ventilator tube, it can also cause psychological trauma.
Data Example
Every time a patient gets a dose of medication, it goes into their medical record. How would we figure out how much they received using data that looks like this:
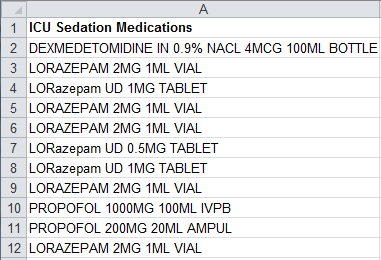
The data set shows:
- the type of sedation
- dose
- volume
- delivery mechanism
However, everything is in one cell. I have found that most of this kind of data requires some preprocessing to get it into a form that can be summarized.
Text to Columns
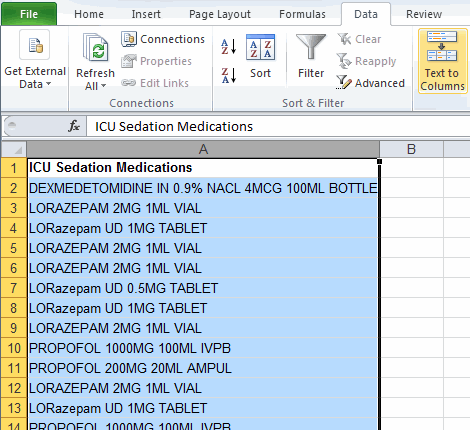
To get to the data we will need to separate the various parts into a table that we can summarize using Excel's PivotTable. We can use Excel's "Text to Column" data tool to start the process:
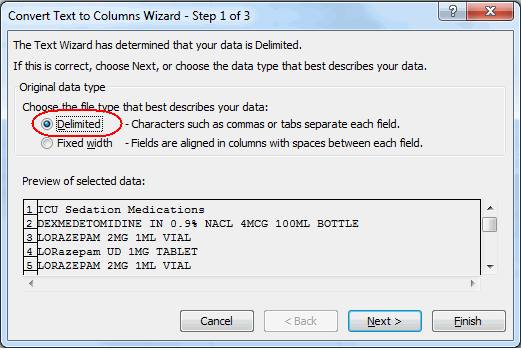
Step 1: Excel will prompt for a description of the data set. Is it delimited or a fixed width?
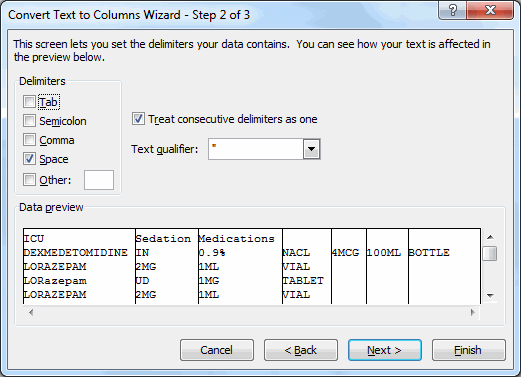
Step 2: What is the delimiter? When do we want Excel to separate the data into separate columns?
Step 3: Set formats for each column (if needed).
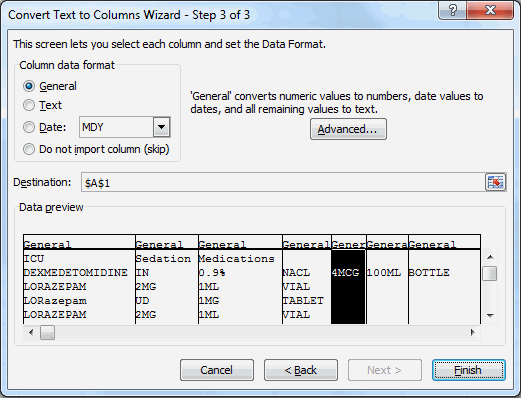
Data Alignment Using Cut and Paste
Some of the cells may need to be realigned to get dose, volume and method in the correct column. Dexmedetomidine has the words "in 0.90% NACL" in-between the medication and dose. So just cut and paste the data into the correct columns:
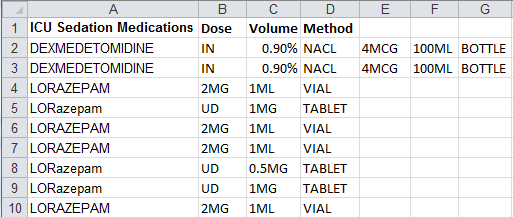
The transformed data now has everything in almost the same column. We will need to do the same thing for LORazepam "UD":
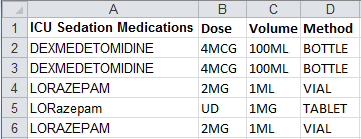
Now we have the dosage (e.g., 4MCG) but we still can't summarize the amounts. We need to split the dose into a number and size.
To do this we need to insert a column after dose and use Text-to-Columns to split the dose on the letter "M":
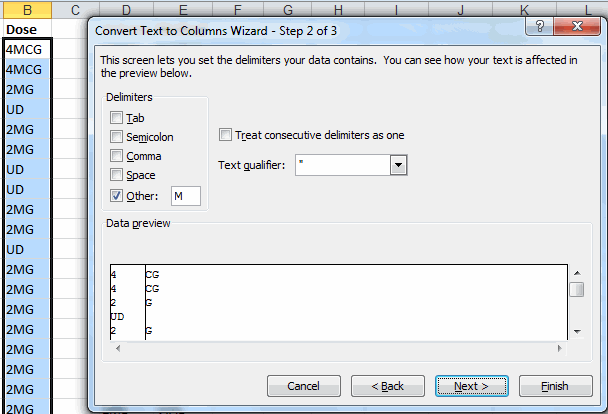
Paste Special Divide
Then, we might have to adjust the numbers a little bit because 1 MCG (micro gram) is 1 milligram/1000. To do this, we can use Excel's Paste Special function to divide the dose (B2:B3) by 1000 (G2):
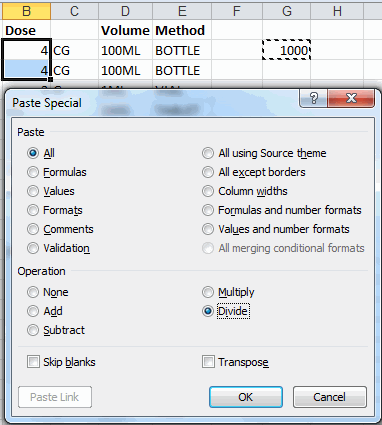
Now we have the correct dosages in milligrams (MG).
Next use copy and paste to make the medication names consistent.
PivotTables
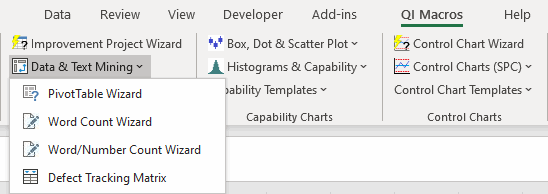
Now run QI Macros PivotTable wizard by selecting column heading cells A1 and B1 and then PivotTable Wizard from QI Macros menu.
I've removed the patient's identification, but we could summarize the medications by patient as well.
Or if we had the dates, we could get a control chart of medication usage by day or week:
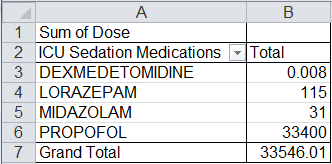
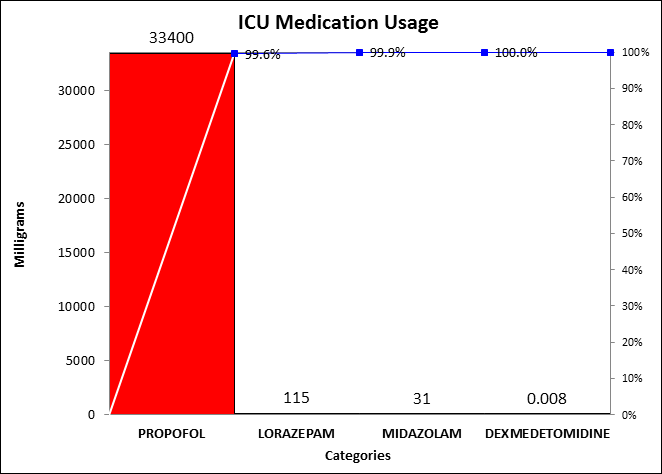
It's pretty clear which medication is used in higher doses...Propofol.
Changing from Sum to Count
If we go back to the PivotTable and right click on cell A1, Excel's will ask how we want to summarize the data. If we change to a "Count" instead of a sum:
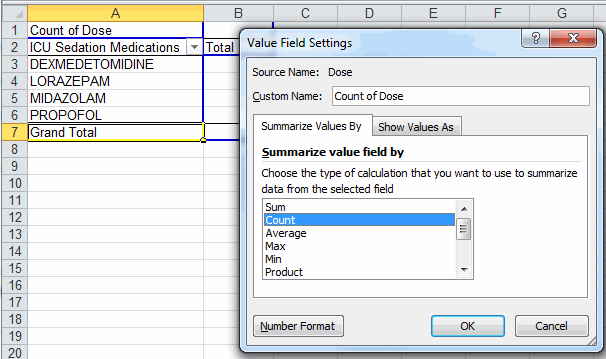
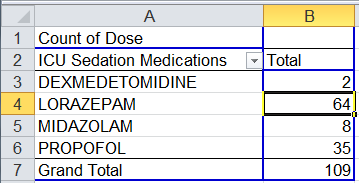
We get a different picture of medication usage:
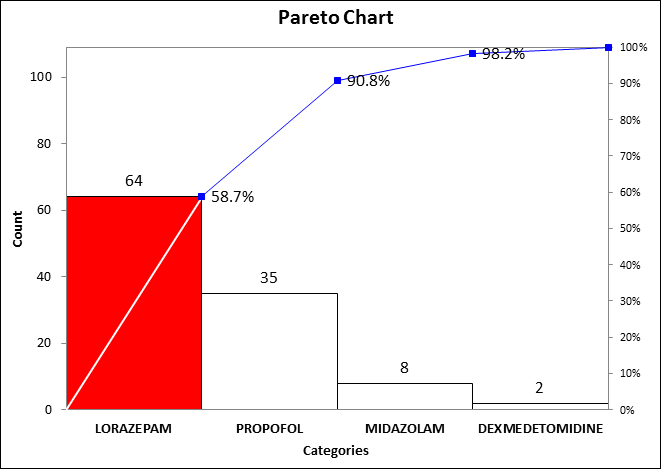
Lorazepam is the most frequent choice for sedation. If we wanted to know more about the dose and method of delivery, we could double click on the PivotTable cell containing the Lorazepam count (B3) to get all of the underlying data:
We could then use PivotTables to summarize the data by dose and method:

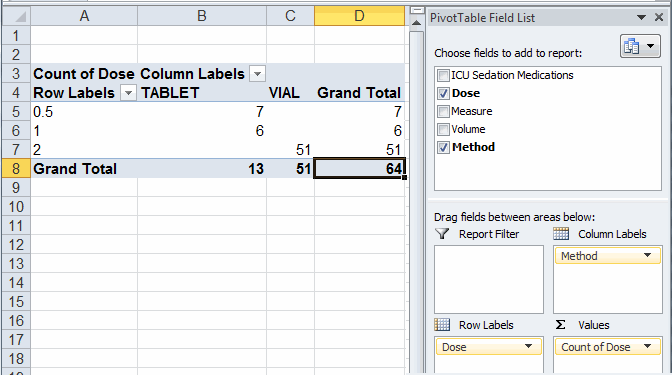
Note: I used Dose as both a Row Label and data value. Most people are unaware that PivotTable fields can be used multiple times. We could then use QI Macros Pareto Chart to chart dosages:
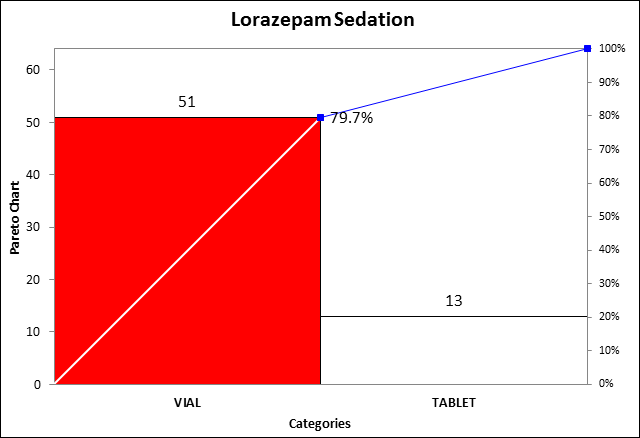
Vials (2MG) are the most common way Lorazepam is delivered.
Which one causes more delirium? Is it the type of sedation or the dosage? Is it the amount of time a patient spends on sedation? Teams are working on the answer as we speak using the ABCDE process. See www.iculiberation.org for more information.
Here's My Point
Sometimes the data you need for analysis can be tightly packed into a single cell. Using Excel's Text-to-Column and PivotTable functions you can data mine the answers you need. Don't let the data intimidate you. There's always a way to get at it.

