Looking for an Example of How to Perform a Gage R&R Study?
Learn the #1 mistake to avoid and how QI Macros Gage R&R template can help mistake proof your analysis.
Why This Matters: GR&R is only as good as how it's set up.
Example of How to Set Up a Good Gage R&R Study
If My Parts Are So Good, Why Is My Gage R&R So Bad?
Almost every week, we get this question from someone trying to conduct a Gage R&R study because their customers are requiring it. They think if their product is good, their Gage R&R should be too.
It evaluates your ability to MEASURE your product accurately and consistently
You need BAD parts to conduct a GOOD Gage R&R Study
Gage R&R Study Basics
Gage repeatability and reproducibility calculates the total variation (TV) from three factors. It then uses total variation to determine how much variation is attributable to appraisers and equipment (%R&R).

Part Variation (PV)
Difference between individual parts

Equipment Variation (EV) - Repeatability
Can one person, using the same gage, measure the same part consistently?

Appraiser Variation (AV) - Reproducibility
Can two people using the same gage, measure the same part consistently?
Warning - the #1 mistake: If your parts are identical, there is NO Part Variation and all of the variation falls to the appraisers and equipment.
Listen to our Gage R&R podcast below!
* Generated using QI Macros' source material via an AI model *
Gage R&R Example
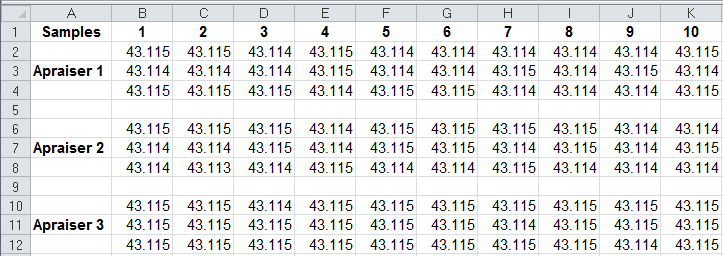
I have dozens of examples, but here's a recent one. The supplier produces parts:
- Target: 43.11
- Tolerance: +/-0.13 (0.26 total)
- USL = 43.11 + .13 = 43.24, LSL = 43.11 - .13 = 42.98
They measured 10 parts with three appraisers. As you can see from the data table below, all parts are only off from the target by a few thousands. NO PART VARIATION.
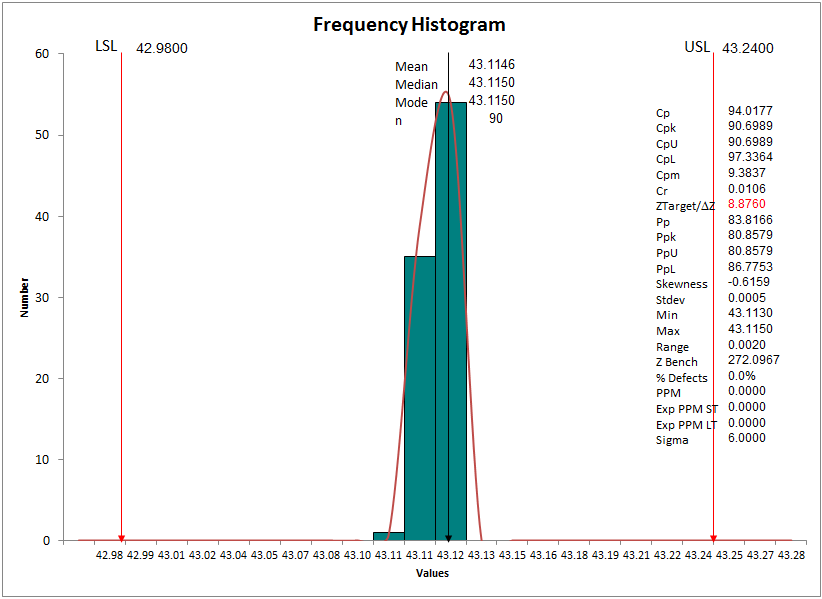
If we run a frequency histogram on this data, you'll see that the capability indices (Cp, Cpk, Pp, Ppk) are excellent:
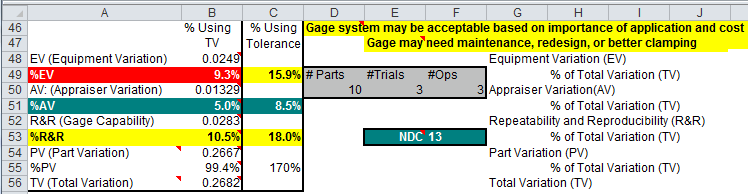
How do you know if you have enough part variation? NDC should be ≥ 5.
NDC is the Number of Distinct Categories. It is a measurement of the variation in your sample parts. If your NDC is less than 5, there isn't enough part variation to use the Average and Range Method or the ANOVA method to calculate Gage R&R.
QI Macros Gage R&R template contains code to flag when NDC is less than 5.
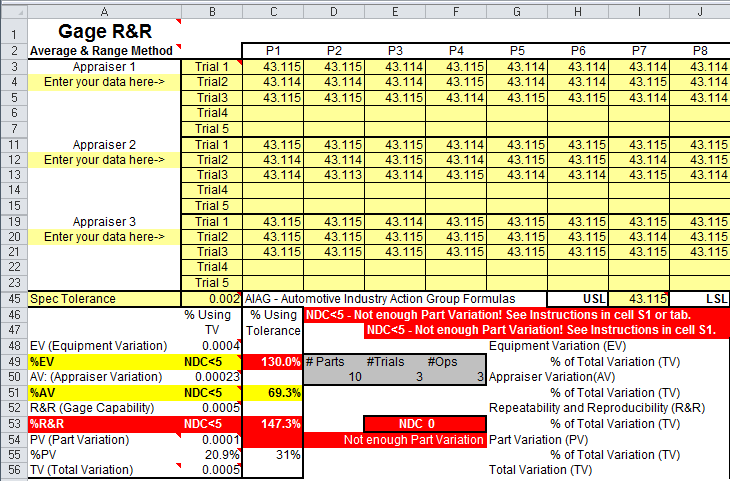
Even though the parts are good, they are too good to test the measurement system. When we put this data into QI Macros Gage R&R template, built in logic tells us the same thing. The calculations in cells A48:B56 contain the warning "NDC < 5".
Specification Tolerance Method
The alternative is to use the Specification Tolerance Method. The Spec Tolerance equals (USL-LSL).
A one-sided Specification Tolerance equals 2*(USL-Xbar) or 2*(Xbar-LSL). AIAG MSA V3 pg. 116-117.
In this example, the spec tolerance is equal to 0.26. If we input this value into cell B45, we get results using the spec tolerance method in column C.
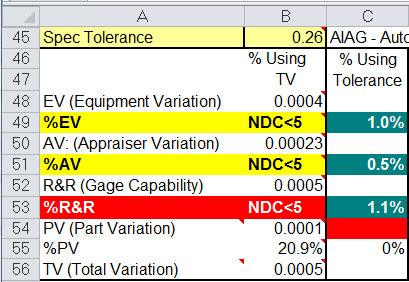
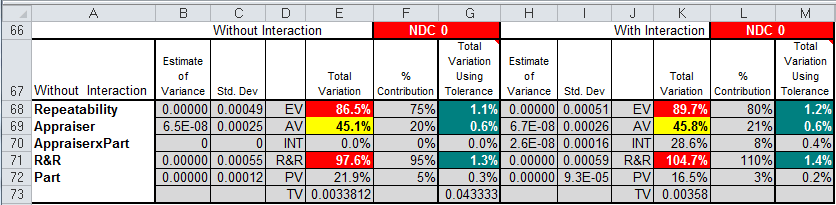
You can even use the specification tolerance with the ANOVA method (%R&R = 1.3%).
But, it can still be hard to explain this to your customers.
A better choice is to go back and make sure you have 10 parts that span the tolerance: (42.98-43.24):
42.98, 43.01, 43.04, 43.07, 43.10, 43.13, 43.16, 43.19, 43.22, 43.24
When to Use With Interaction and Without Interaction
If your p value in Appraiser x Part < 0.05 (or your Alpha), use With Interaction
If your p value in Appraiser x Part > 0.05 (or your Alpha), use Without Interaction
Here's the Point
Gage R&R doesn't measure the quality of your parts, only the quality of your measurement system. If you want customers to trust your part quality, you have to learn how to properly evaluate measurement variation.
You don't have to be an expert.
Use QI Macros Gage R&R template to mistake-proof your calculations.
Download a free 30-day trial. Get the Gage R&R template now!
QI Macros Draws These Charts Too!
