Looking for a Pareto Chart Template in Excel?
QI Macros has a ready made template that draws Paretos in seconds!
Pareto charts can be cumbersome to draw in Excel. That's why we created this easy to use fill-in-the-blanks template.
To use QI Macros Pareto template, simply:
- Open the Pareto chart template by clicking on QI Macros menu > Chart Templates > Pareto Chart.
- Input your labels in A3:30, data in B3:30 and chart title in cell B1.
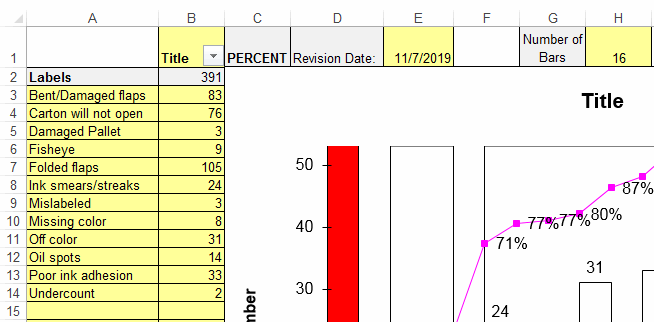
- If you have more than 10 rows (e.g. types of defects or errors) consider consolidating them into an "Other" category using the input cell in H1. In this example, the default is 16 but we will change it to 9.
- Double Click the "Update Chart" button.
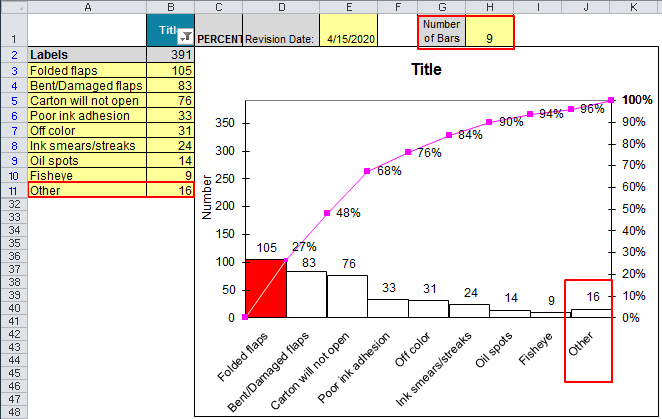
- QI Macros will perform all of the calculations and re-format the Pareto. Per the entry in cell H1, the new Pareto has 10 bars and the last bar is a summary of the remaining categories into an "Other" bar.
Learn More...
Stop Struggling with Pareto Charts!
Start creating your Pareto Charts in just minutes.
Download a free 30-day trial. Get Pareto Charts now!
QI Macros Draws These Charts Too!
