Struggling to Create a Weighted Pareto Chart?
QI Macros has a ready made weighted Pareto chart template!
Use a weighted Pareto when some error categories are more costly than others.
For example, some categories may:
- be more expensive to fix
- take more time to fix
- have a greater impact on the customer.
How to Use QI Macros Weighted Pareto Chart Template.
-
Click on QI Macros menu and select Chart Templates > Pareto Chart. Next, select the "Weighted Pareto Chart" tab:

- Input your category descriptions in column A, the number of defects in column B, and the weight you want to assign to each defect in column C.
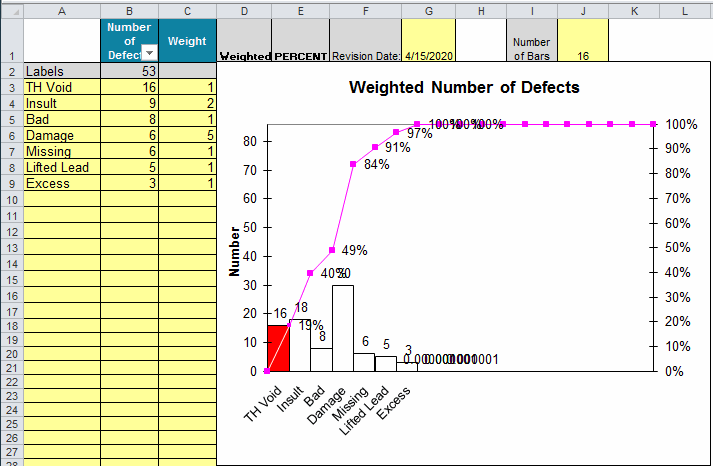
- If you have more than 10 rows (e.g. types of defects or errors) consider consolidating them into an "Other" category using the input cell in J1.
- Double Click the "Update Chart" button that is located to the right of the chart.
- QI Macros will perform all of the calculations and draw the Weighted Pareto.
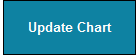
In this example, the "Damage" category is the biggest bar on the chart, even though there were only 6 defects. It is the biggest bar, because it has the highest weighted value (30 = 6 defects x 5 weight.)
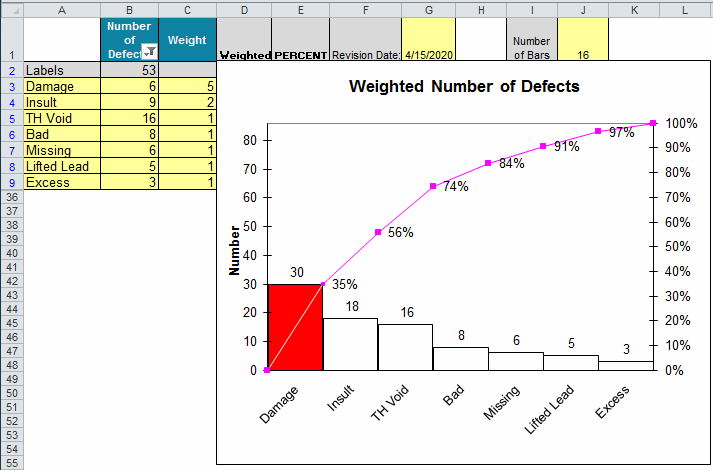
How to Create a Pareto Chart of Weighted Costs
If you know both the # of defects and cost for each defect, consider the cost per defect as the "weight".
Input the number of defects in column B and the cost per defect in column C. Now double click the "Update Chart" button to get a Pareto chart of weighted costs per location.
I really like the QI Macros. The Pareto Chart is worth the purchase price of the whole deal.
Mike Dean, Ellwood Texas Forge
Learn More...
- Learn how to create Pareto charts in Excel using QI Macros add-in
- Summarize Data with a PivotTable and Create a Pareto with One Click
- Paynter Chart Template
Stop Struggling with Pareto Charts!
Start creating your Pareto Charts in just minutes.
Download a free 30-day trial. Get Pareto Charts now!
QI Macros Draws These Charts Too!
