Do You Understand the Pareto Principle? The 80-20 Rule?
We'll Explain It and Teach You How to Draw a Pareto Chart in Excel!
Pareto's Law and Principle of Distribution
In the late 1800s, when Vilfredo Pareto, an Italian mathematician, created what we've come to know as the 80-20 rule, it changed how we think about life and business. And it laid the groundwork for TQM and Six Sigma.
Pareto observed that 20% of the people held 80% of the wealth. The Pareto principle also suggests that even if the wealth was redistributed equally to everyone in society, in a very short time it would revert back to the 80-20 distribution.
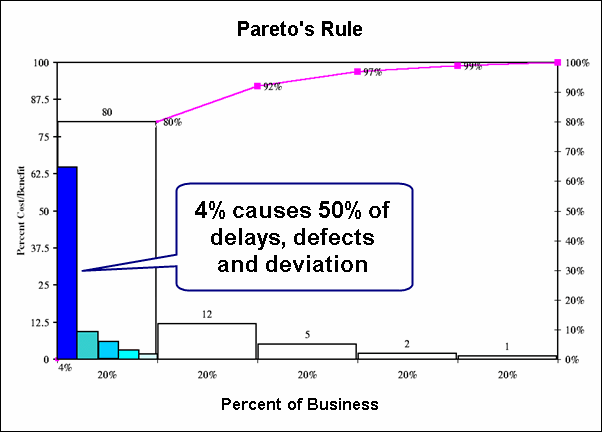
The 80/20 rule implies that 80% of the benefit comes from 20% of the causes. Similarly, 20% of a business causes 80% of the delay, defects and lost profits. The goal of any business is to focus on increasing the 20% of customers and business activities that drive revenue and focus on reducing the 20% of the business that cause unnecessary costs.
Joseph Juran found that most businesses waste 25-40% of their budget finding and fixing problems.
Pareto's Principle is a Power Law
While many business activities have a linear (i.e., 1-2-3) progression; the 80-20 Rule is a power law. It follows an exponential (i.e., 2-4-16-64) progression. If you apply the 80-20 rule to itself, you'll find that as little as 4% of the business produces over 50% (64% to be exact) of the delay, defects and lost profit. Jay Arthur calls this the 4-50 rule.
In America, for example, 4% of Americans hold over half the wealth.

Applications of the Pareto Principle
On the revenue side of a business, this means that if you have 100 customers:
- 80 will buy a single product
- 20, on average might buy 4 products
- 4 of the 20 will buy 16 products
- 1 of the 4 will buy 80 products
The goal, of course, is to figure out the mental and geographical demographics of the top four customers, and find a way to snag more of them.
For example, I watch golf on TV. What are the most prominent types of commercials for golf matches? Erectile dysfunction and prostate problems. What does this mean about the demographics of golf viewers? We're older and may have either of these two health problems.
Analyze your customers and the Pareto distribution in their buying patterns. Who represents the Pareto Principle in your customer base? How can you reach more of them?
Pareto Distribution of Defects
Joseph Juran, one of the father's of the quality movement, restated the Pareto Principle as the difference between the "vital few and the trivial many."
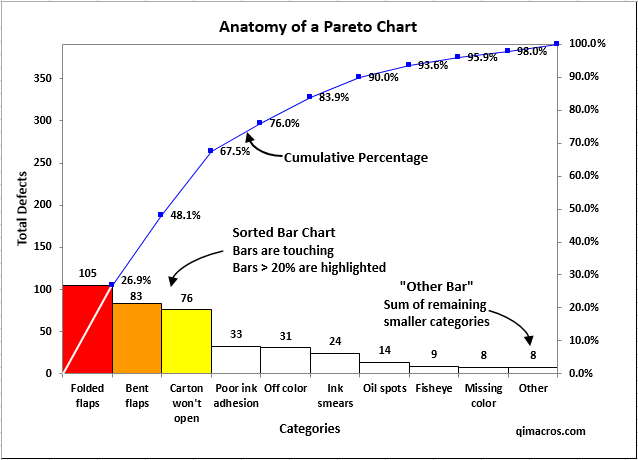
Shewhart, Juran and Deming found that errors, mistakes and defects were not evenly spread over a business; instead they tended to cluster in a few steps of the process. If the delivery of a product or service takes 100 steps, one often finds a Pareto pattern to the distribution of defects:
- 80 steps will be error free
- 20 steps will cause 80% of all errors
- 4 steps will cause 64% of all errors
- 1 step alone may cause over half of all errors
The quality movement even invented a chart to display this pattern, called a Pareto chart:

Pareto Distribution Example of Delay
The same is true of delays. Delays occur between steps in a process. One or more of these delays causes over half of all product or service delays. If a business wants to be faster, it must eliminate the delays between steps, not try to make the steps faster.
Key Pareto Concepts to Remember
- The Pareto Principle (aka the 80/20 rule) is a power law.
- There is a Pareto pattern to the distribution of money, delay and defects that can be leveraged to maximize profits and minimize costs in any business.
- The Pareto chart is a useful way of displaying this pattern.
More Pareto Chart Resources
- What is a Pareto Chart?
- Learn how to create Pareto charts in Excel using QI Macros add-in
- Pareto Analysis Example
Stop Struggling with Pareto Charts!
Start creating your Pareto Charts in just minutes.
Download a free 30-day trial. Get Pareto Charts now!
QI Macros Draws These Charts Too!

