Want to Create a Speedometer Chart in Excel?
QI Macros add-in has a Ready-Made Speedometer Template!
Why it Matters: Use a Speedometer Chart to help you show the status of process performance.
You might also consider a Bullet Chart.
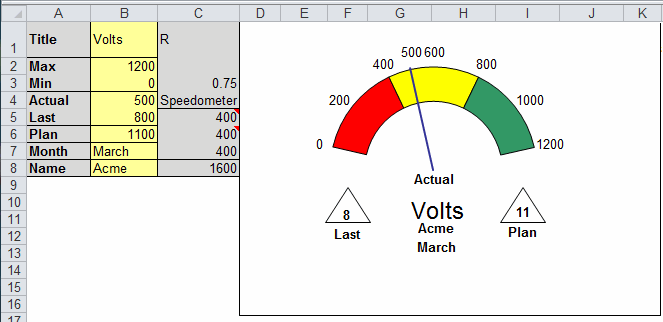
Example of QI Macros Speedometer Template
How to Create a Speedometer Chart using QI Macros Template
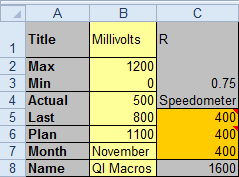
The template has several fields that drive the chart: Title, max, min, actual, last, plan, month, and name. It also has three fields (C5:C7) that divide the speedometer into red, yellow and green sections. The data below was used to create the chart above.
- All input areas are in yellow or orange.
Cells C5:C6 contain comments describing how to change these fields.
When you change a value it will change the corresponding item on the chart. - Title - changes the chart title.
- Min and Max change the starting and ending points of the dial.
- Actual - designates where the needle is.
- Last and Plan - change the values in the triangles but do not effect the chart.
- Month and Name - change values on the chart near the title.
- The orange input areas define the breaks between red, yellow and green. If you change one number the other two calculations will divide the area equally but this can be overridden.
Haven't you waited long enough?
Start creating your Speedometer Chart in just minutes.
Download a free 30-day trial. Get the Speedometer Chart now!
The Speedometer Chart is one of many charts and tools included in QI Macros add-in for Excel.
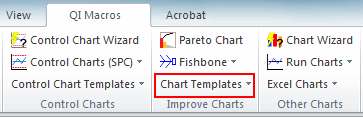
QI Macros adds a new tab to Excel's menu, making it easy to find and open any chart template you need.