Quality Improvement Charts in Excel
Paretos and fishbones are keys to a successful improvement effort
QI Macros can help you create Pareto Charts and Fishbones in Excel.
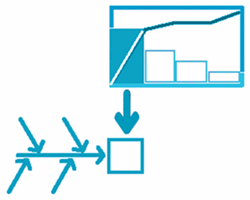
Pareto charts help us to focus our improvement efforts while fishbones help us get to the root cause.
Once you have created a pareto chart, the big bar becomes the problem statement on your fishbone diagram.
QI Macros makes creating these and other charts a snap.
Paretos, fishbones and other improvement chart templates can be found on the right side of QI Macros menu.
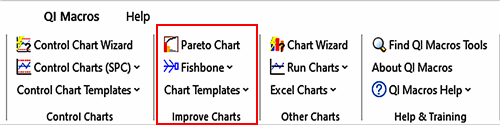
To create a Pareto chart: select your data, click on Pareto Chart and QI Macros does the rest.
To create a fishbone diagram: open the fill in the blanks template, input your data, click create fishbone and QI Macros does the rest.
The remaining "Improvement Charts" are fillable templates. Refer to the "Other Chart Templates" section of the Knowledge Base for further details.
Why choose QI Macros for your process improvement needs?
![]()
Faster to Learn
and Easier to Use
- Works right in Excel
- Create charts in seconds
- Easy to customize & share charts
- Free Training Anytime
![]()
Proven and Trusted
- More than 100,000 users
- In More than 80 countries
- Five Star CNET Rating - Virus free
![]()
Affordable
- Only $379 USD
Quantity Discounts Available - No annual subscription fees
- Free technical support
