Need to Create a Line Graph with a Target Line in Excel?
QI Macros has a Ready-Made Target and Line Chart Template!
Why it Matters
Line Charts are one of the most popular charts used. A line chart has an X axis (horizontal axis on the bottom) and a Y axis (vertical axis to the left). The X axis almost always represents time (hours, days, months, etc.) Therefore, in some industries, a line chart is referred to as a Time Series Chart.
A Target Line is used to compare the actual value of your data set to that of your projection or goal.
Example of QI Macros Target and Line Chart Template
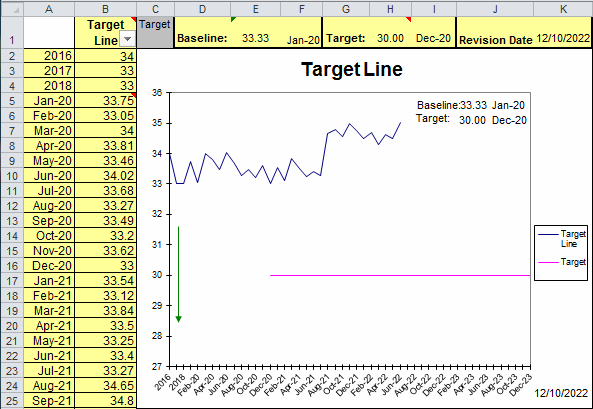
To complete the Target and Line Chart template:
- Input your Baseline in cell E1 and the first date that the baseline applies in F1.
- Next, input your Target in H1 and date due in I1.
- Then, set your Revision Date in K1.
- Lastly, input your dates and data in cells A2 through B52:
Haven't you waited long enough?
Start creating your Target and Line chart in just minutes.
Download a free 30-day trial. Get the Target and Line chart now!
The Target and Line chart is one of many charts and tools included in QI Macros add-in for Excel.
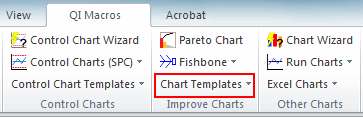
QI Macros adds a new tab to Excel's menu, making it easy to find and open any chart template you need.