Need to Draw a Delta Chart in Excel?
QI Macros has a Ready-Made Delta Chart Template!
Why This Matters: Delta Charts show current and predicted performance versus benchmarks.
Here is an example using the QI Macros delta chart template:
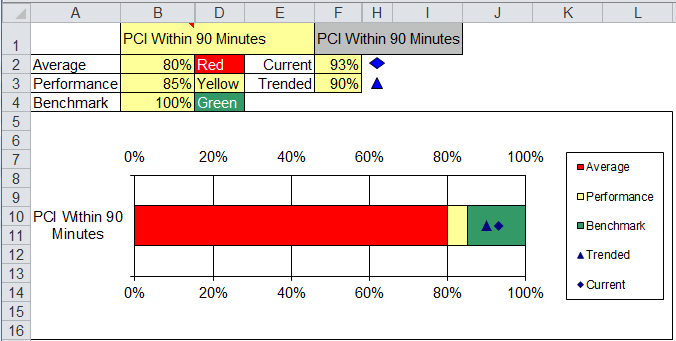
* The example above uses healthcare data, showing performance against a core hospital measure - door to balloon time for angioplasty.
Why Use a Delta Chart?
Use Delta to show how current performance stacks up against the benchmarks.
- Enter your titles in B1 and F1.
- Put benchmark data in B2:B4 to create red-yellow-green bar.
- Put current and trended performance in F2:F3 to create diamond and triangle.
Haven't you waited long enough?
Start creating your Delta Chart in just minutes.
Download a free 30-day trial. Get the Delta Chart now!
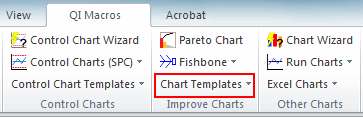
The Delta Chart is one of many charts and tools included in QI Macros add-in for Excel.
QI Macros adds a new tab to Excel's menu, making it easy to find and open any chart template you need.