Looking for a Kaplan-Meier Step Plot Template in Excel?
QI Macros has Three Ready-Made Kaplan-Meir Step Plot Options
Why it Matters: Kaplan-Meier Step Plots are used in health care to show survival rates over time for various protocols and treatments.
QI Macros Kaplan-Meier Step Plot Templates
Kaplan-Meier Plot One Group
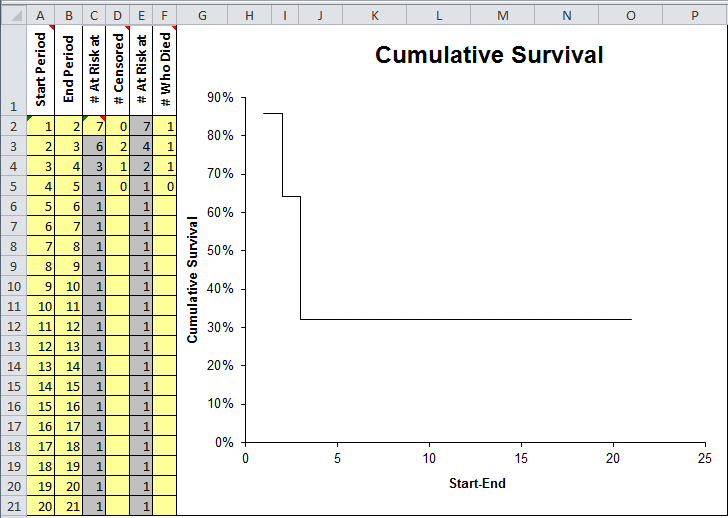
Data entry fields are shaded in yellow:
- Start Period (Could be a date or number)
- End Period (Could be a date or number)
- # At Risk at Start of the Period
- # Censored (Number removed from the study for various reasons)
- # At Risk at End
- # Who Died
The Y axis shows the cumulative survival rate. Cumulative survival rate may level off at the end of the study because patient survival is no longer tracked.
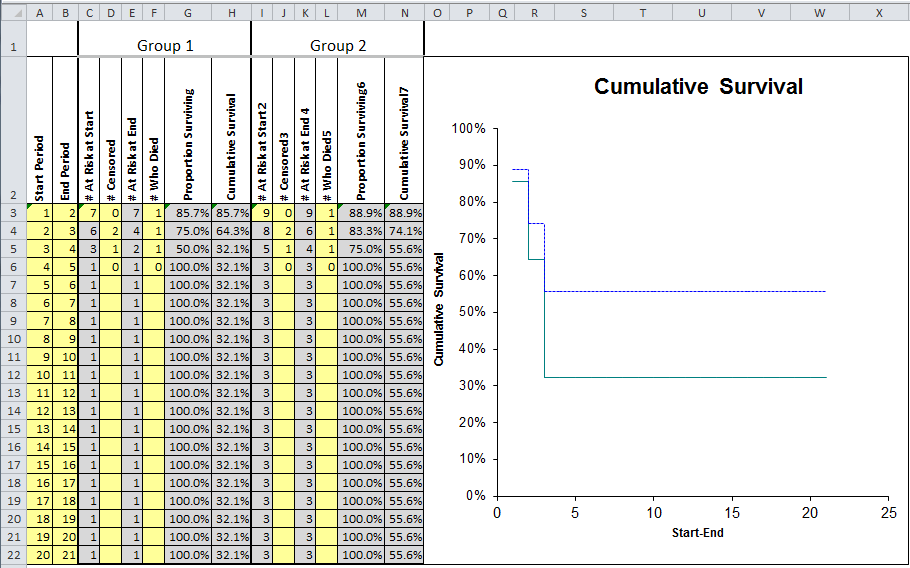
2. Kaplan-Meier for Two Groups
This template works just like the first template but compares data for two groups.
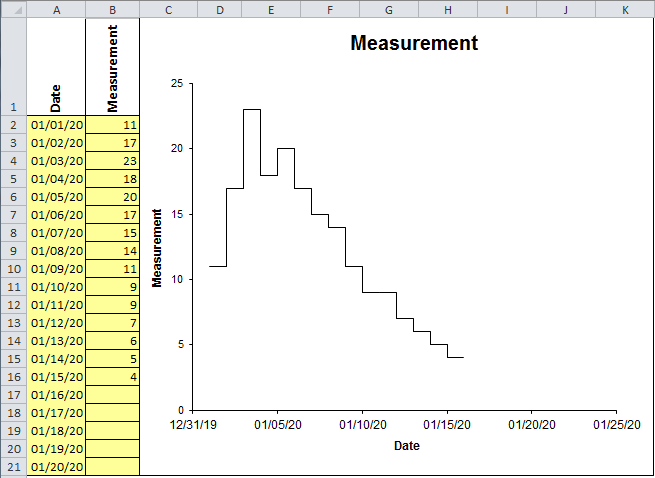
3. Step Plot Template
Haven't you waited long enough?
Start creating your Kaplan-Meir Step Plot in just minutes.
Download a free 30-day trial. Get the Kaplan-Meir Step Plot now!
The Kaplan-Meir Step Plot is one of many charts and tools included in QI Macros add-in for Excel.
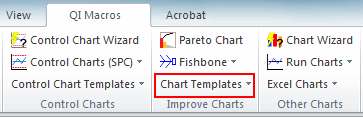
QI Macros adds a new tab to Excel's menu, making it easy to find and open any chart template you need.