Need to Draw a ROC Curve in Excel?
QI Macros has a Ready-Made ROC Curve Template!
Why It Matters: Receiving Operating Characteristic (ROC) curves are used to choose the most appropriate "cut-off" for a test.
Example of QI Macros ROC Curve Template
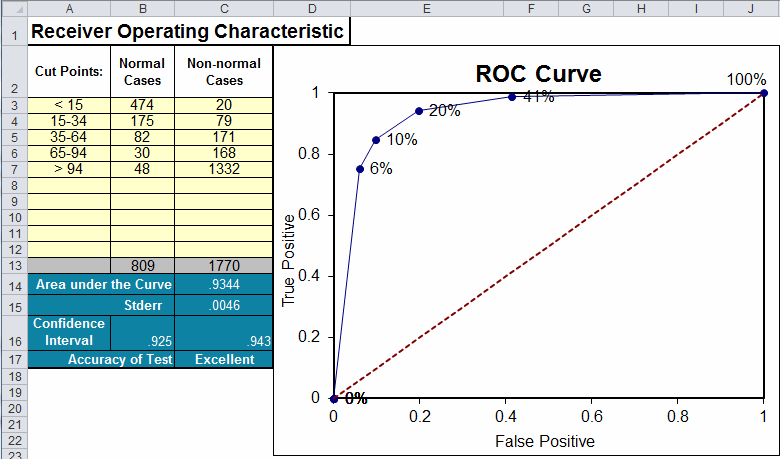
How to complete a ROC Curve using the template:
- Input the Cut Points in column A.
- Input the number of normal and non-normal cases in columns B and C, respectively.
- The template will perform the calculations and draw the ROC Curve.
- The template will also calculate the area under the curve (C14) and rate the accuracy of the test (C17).
- > .9 = Excellent
- > .8 = Good
- > .7 = Fair
- ≤ .7 = Poor

For a comprehensive description of ROC Curves see: https://darwin.unmc.edu/dxtests/ROC1.htm
Haven't you waited long enough?
Start creating your ROC Curve in just minutes.
Download a free 30-day trial. Get the ROC Curve now!
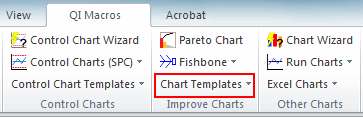
The ROC Curve is one of many charts and tools included in QI Macros add-in for Excel.
QI Macros adds a new tab to Excel's menu, making it easy to find and open any chart template you need.