Six Sigma Tools Made Easy
Are you having trouble:
- Drawing Pareto Charts in Excel?
- Choosing and Using Control Charts to analyze performance?
- Figuring out how to draw histograms to analyze the capability of your processes?
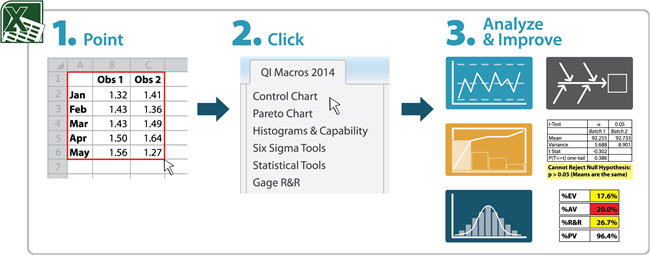
QI Macros Creates Six Sigma Tools in Three Easy Steps

What Customers Say About QI Macros Six Sigma Software
"The coolest easiest to use software ever"
"So simple anyone can use it"
"It's exactly what we were looking for"
...It's like a magic program. You input the data, you click the button and, "poof," there it is!
It's all done for you. It's great, I love it...- National Association of Healthcare Quality Conference

Six Sigma Tools in QI Macros with links to more detail
Attribute Control Charts
Wizards
Other Control Charts
- g chart
- t chart
- Laney p' Chart (p Prime)
- Laney u' Chart (u Prime)
- Analysis of Means chart
- Levey Jennings Stdev chart
- Levey Jennings 10-20-30% chart
- Moving Average chart
- EWMA chart
- Cusum Chart
Multivariate Analysis
Variable Control Charts
- XmR - Individual Moving Range chart
- XmR Trend chart
- I-MR-R chart
- X Median R chart
- X bar R chart
- X bar S chart
- Capability Suite - Stability, Capability and Data Normality Analysis in One
Pareto, Pie and Bar Charts
Histograms with Cp, Cpk for Process Capability Analysis
- Capability Suite - Capability, Stability and Data Normality Analysis in One
- Histograms with Cp, Cpk
- Histograms with Weibull Analysis
- Frequency Histograms with Cp, Cpk
- Show Before and After Histograms
Other Charts to Analyze Variation
Time Series Charts
- Run Chart—average and median
- Line Graph
- Combination Chart - Line + Column Chart and Bar + Line Chart
Map of Six Sigma Tools to DMAIC
Six Sigma Test Data in QI Macros
Why wait? Start creating these charts and diagrams in seconds using
QI Macros add-in for Excel.

