QI Macros Enhancements - What Are You Missing?
Take Advantage of New Time Saving Features
QI Macros are regularly enhanced based on customer feedback and industry updates.
Enhancements include:
- New Charts, Templates and Tools
- New Features to Save You Time
- Updates to be consistent with industry standards like the AIAG, Joint Commission on Healthcare, IHI etc.
- Updates to remain compatible with the latest Microsoft Windows and Excel updates

QI Macros 2026 is Compatible with:
- Excel 2021/2024/Office 365 (PC) | 2021/2024/Office 365 (Mac)
- Windows 10 and 11 (PC) | macOS (Mac)
Which Version Do I Have?
QI Macros menu indicates the year you purchased your license. To find the month purchased:
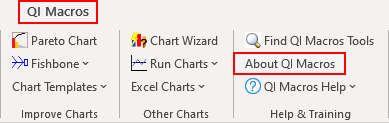
1. Click on QI Macros menu and then on About the QI Macros:
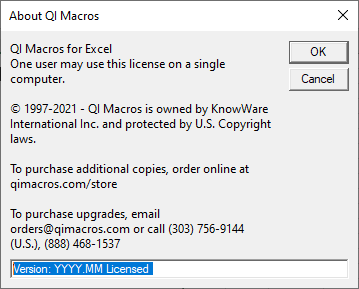
2. A window will open which indicates the Year and Month you purchased in YYYY.MM format:
Chronological List of Enhancements
QI Macros Version # |
Description of Enhancements |
|---|---|
2026.07 |
|
2026.01 |
|
2025 |
Highlights
Crow-AMSAA added to Statistical Tools "Find QI Macros Sample Data" functionality added Fleiss' Kappa Statistics outputs added to the Attribute Gage Worksheet Johnson Transformation added to Statistical Tools Nested Gage R&R template added to the MSA 4th Gage R&R Taguchi L9 and L12 templates added to the Design of Experiments |
2025.07 |
|
2025.01 |
|
2024 |
HighlightsDeming Orthogonal Regression option added to Statistical Tools LogNormal Data Transformation added to Statistical Tools APQP 3rd Edition and Control Plan 1st Edition templates added to APQP and Control Plan 2nd Edition templates Dixon's Q Test added to Statistical Templates Grubbs' Outlier Test added to Statistical Templates Equivalence (TOST) Test - Paired Data added to Statistical Tools Contour Plots added to the DOE (Design of Experiments) Full Factorial, Fractional Factorial 8-Run, and Fractional Factorial 16-Run templates Heijunka Board template added to the "Lean Takt Time - NVA" template 5S Scorecard and 5S Cleaning Assessment templates added to the "Lean Scorecard" template Add UCL-CL-LCL Labels to a Point macro added to Chart Menu options Improvements made to Process Change Wizard code |
2024.10 |
|
2024.07 |
|
2024.04 |
|
2024.01 |
|
2023 |
Highlights30-60-90 Day Action Plan added to Action Plan Binomial Capability Analysis and Poisson Capability Analysis added to Capability Templates Binomial Logistic Regression added to Logistic Regression Multinomial Logistic Regression added to Logistic Regression Bollinger Bands Chart added to Control Chart macros Driver Matrix added to Tree Matrix MANOVA One-Way macro added to Statistical Tools RACI template added to SWOT template Replace Zeros with Blanks added to Restacking functionality Variance Inflation Factor (VIF) added to Multiple Regression XmR multiple column option added to XmR Chart macro |
2023.10 |
|
2023.07 |
|
2023.04 |
|
2023.01 |
|
2022 |
Highlights"Remove" option added to Process Change and Ghost Point Show/Hide Rule Numbers gives end user Control Chart Rule descriptions Revamped Process Change and Fixed Control Limits functionality Value Stream Map now allows up to 108 Steps/Processes Mood's Median Test added to Non-Parametric templates Equivalence Plot added to the Equivalence (TOST) Test output AutoCorrelation added to Statistical Tools XmR Autocorrelated added to Control Charts Logistic Regression (Binary) added to Statistical Tools Honest Gage R&R added to Gage R&R MSA 4th Turtle Diagram template added |
2022.10 |
|
2022.07 |
|
2022.04 |
|
2022.01 |
|
Prior Years |
Join 100,000+ Users
in 80 Countries


KnowWare International, Inc.
2696 S. Colorado Blvd., Ste. 555
Denver, CO 80222 USA
Toll-Free: 1-888-468-1537
Local: (303) 756-9144
©
1997 - 2026 KnowWare International Inc. All Rights Reserved. Legal Info | Terms of Use