Struggling to Add the Median Value on Your Box and Whisker Plot?
QI Macros automatically displays the median on box plots it creates!
To draw a Box Plot using QI Macros:
- Select your data.
- Select Box, Dot & Scatter Plot > Box & Whisker from QI Macros menu.
- QI Macros will do the math and draw the graph for you.
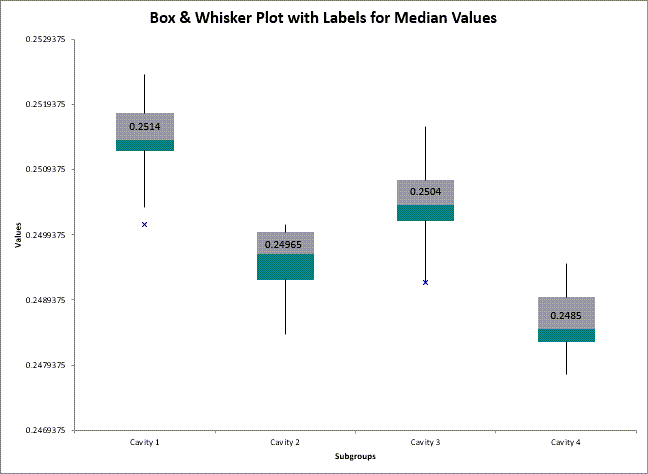
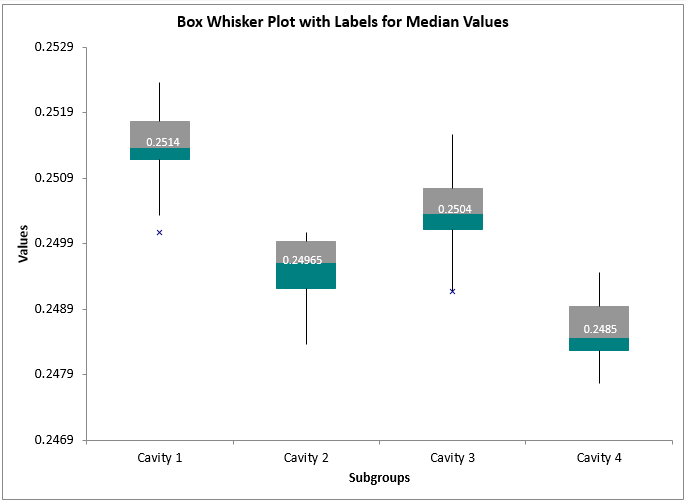
Example of QI Macros Box and Whisker Plot with median values displayed
Instructions for adding median values to QI Macros box plots prior to April 2023 release
QI Macros has to go through many gyrations to get Excel to draw a good box plot. The values for the boxes are not the actual Q1, Median and Q3. They are the height of the box, not the actual value. To show the Q1, Q3 and/or the median, you will want to add another data series to the chart as follows:
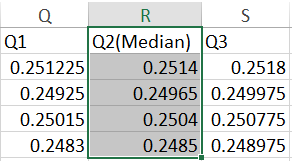
- Select and copy the Median, Q1, and/or Q3 values from the data sheet:
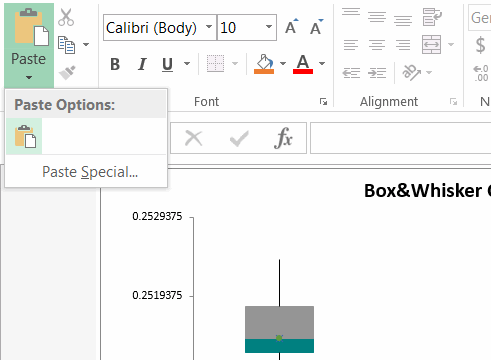
- Paste the data into the Box and Whisker Plot:
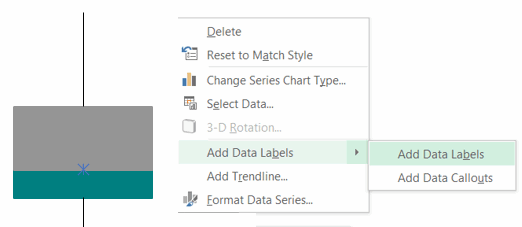
- Now you have a marker for the data point. To add a label for the value, right-click on the new point on the chart (in-between the two boxes) and click Add Data Labels:
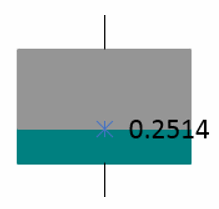
- Here is what the box should look like:
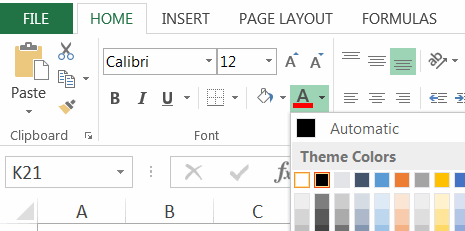
- Next, you can use Excel's formatting capabilities to hide the marker and to change the text to white.
Change marker type to none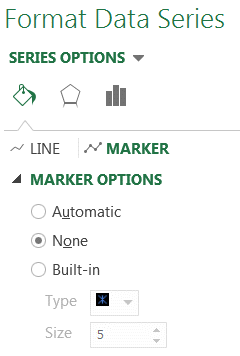 Change text to White
-
Here is what the final box looks like:
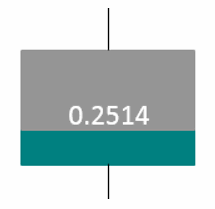
Excel Box Plot with Median Added
Stop Struggling with Box Whisker Plots!
Start creating your Box Whisker Plots in just minutes.
Download a free 30-day trial. Get Box Whisker Plots now!
QI Macros Draws These Charts Too!
