How to Add Levels to a QI Macros Bullet Chart
Step by Step Example of Adding a 4th Level
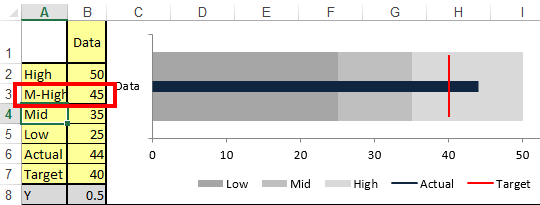
- Insert data for the new level:
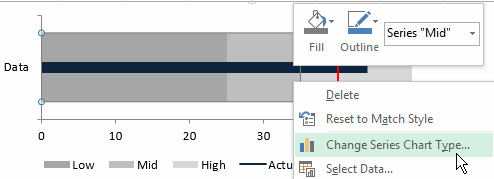
- Copy/Paste new data into your Bullet Chart (copy cells, click on the chart and paste - Ctrl + V) :
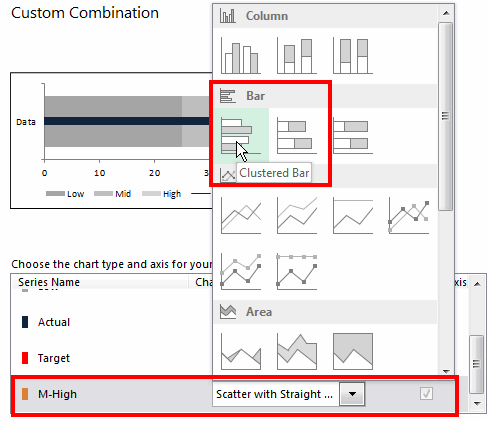
- Change Series Chart Type to "Clustered Bar (horizontal bullet) or Clustered Column (vertifical bullet) :
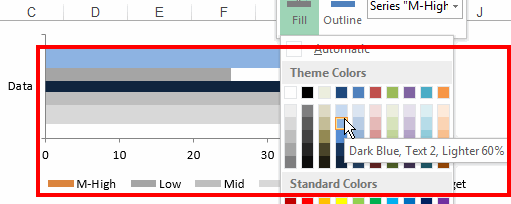
- Next, right-click on the new Bar and Change Colors:
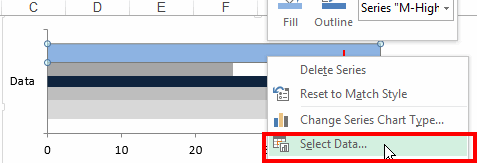
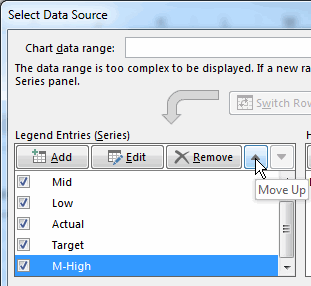
- Then, right-click on the chart, click "Select Data", and move up to correct place:
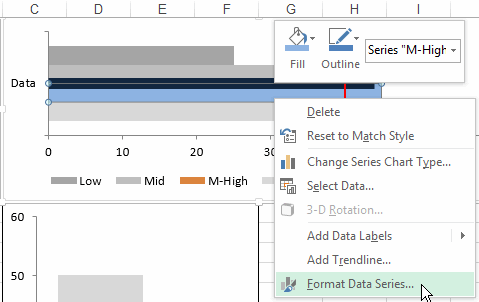
- Right-click on the new bar and select "Format Data Series":
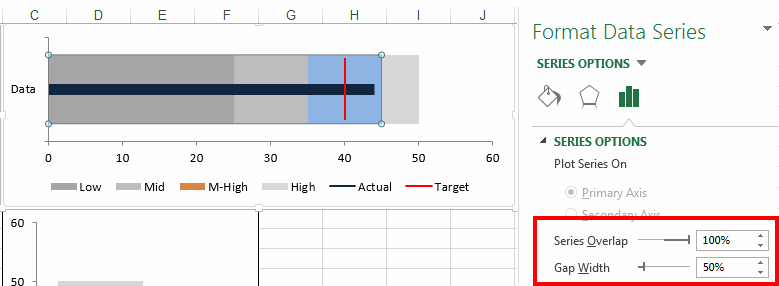
- Lastly, the change "Series Overlap" to 100% and "Gap" to 50%

Haven't you waited long enough?
Start creating your Bullet Chart in just minutes.
Download a free 30-day trial. Get the Bullet Chart now!
The Bullet Chart is one of many charts and tools included in QI Macros add-in for Excel.
QI Macros adds a new tab to Excel's menu, making it easy to find and open any chart template you need.


