Not Sure How to Perform a Design of Experiments?
Here's a DOE example using a familiar task and DOE template in Excel
QI Macros DOE Template
- Click on QI Macros menu > DOE GageR&R FMEA >
Design of Experiments. - Conduct your DOE and enter the data in the template.
- Analyze results.
Design of Experiments Example
For simplicity, let's assume you are writing a cookbook and want to find the best directions for baking a cake (which is similar to baking paint on a car finish). You can save time by performing a design of experiments test.
First, determine the "factors" you want to test and establish the high-low settings for each factor in your study. Let's suppose you have four factors (a four factor experiment):
- Pan shape: Round (low) vs. square (high) pan
- Ingredients: 2 vs. 3 cups of flour
- Oven temperature: 325 vs. 375 degrees
- Cooking Time: 30 vs. 45 minutes
Let's say that you'll rank each resulting cake on a 1-10 scale for overall quality.
You then use the +/- values in the orthogonal array to perform a test of every combination (16 total):
- High: all high values (+ + + +) = square pan, 3 cups, 375 degrees, 45 minutes
- Low: all low values (- - - -) = round pan, 2 cups, 325 degrees, 30 minutes
- In Between: every other combination (+ + + -), (+ + - -), and so on.
To optimize your results, you might want to run more than one test of each combination. Then you just plug your data into a DOE template (Taguchi or Plackett-Burman format) like the one in the QI Macros and observe the interactions.
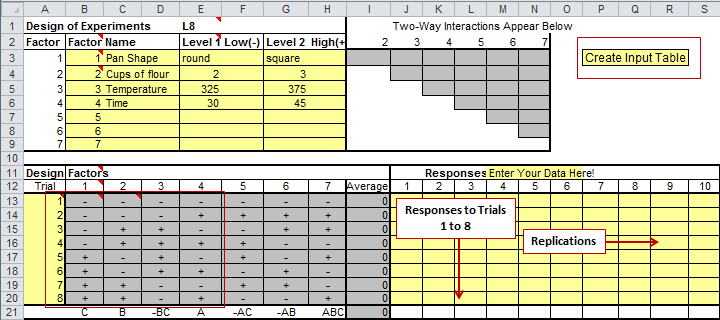
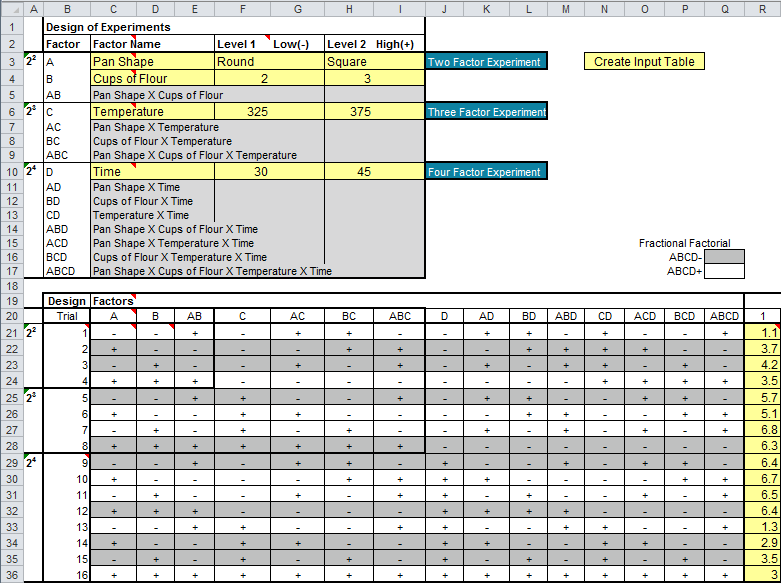
Here is an example of the QI Macros L8 Taguchi Template for Excel
- Input areas are shaded yellow for easy identification.
- The four factors are inputted in rows 3 to 6.
- The red outline shows the combination of factors that will be used for each of the 8 trials.
- The results (responses) for each trial (rating cake quality on a scale of 1 to 10) are input in columns J thru S in the responses section. The number of columns used depends on the number of times you choose to replicate each trial. If you test each combination only once then you would only complete the cells in column J.
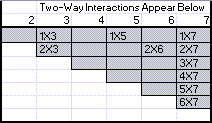
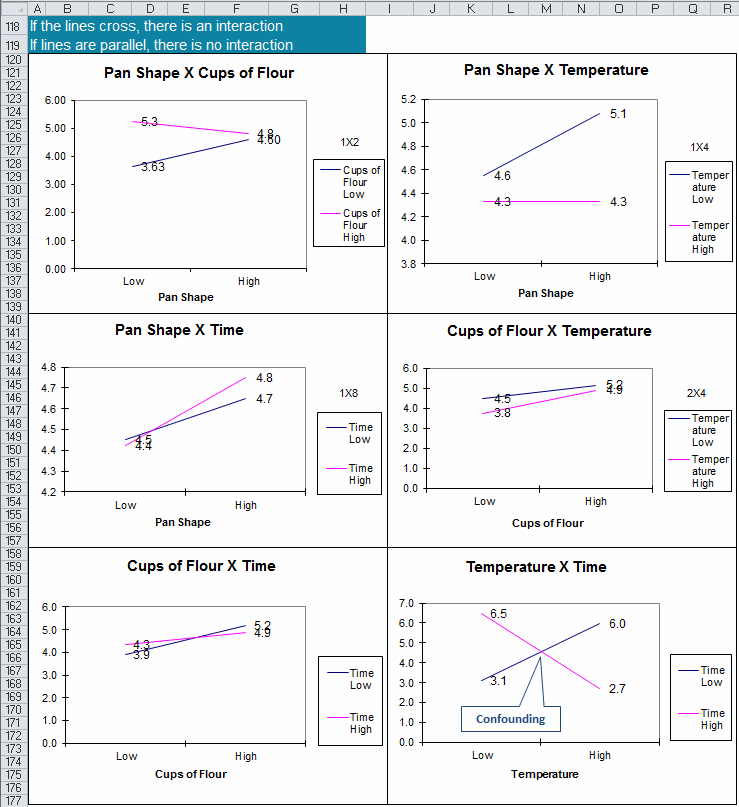
NOTE: If there are empty cells in the Two-Way Interactions table, this means there are no interactions between those factors:
Create an Input Table
If you have a hard time keeping track of the trial combinations (i.e. - + + -) then you can create an input table that is easier to follow. Just click on the "Create Input Table" button.
A new sheet will be automatically created with the Input Table:
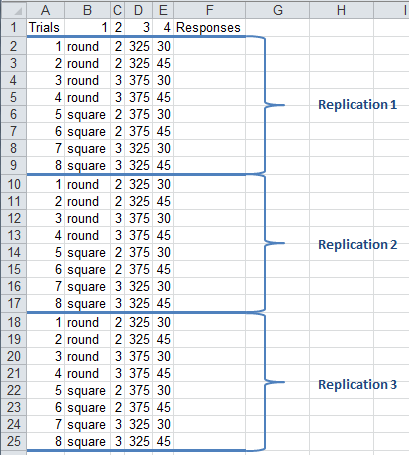
Once you have populated the "Responses" column in your Input Table, you would then populate your Responses table in the Design of Experiments template. It is recommended to have a minimum of (8) Replications, and (10) Replications is the maximum number of replications that can be included in our DOE templates.
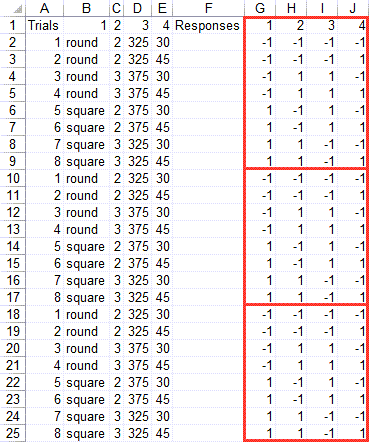
NOTE: You can also use the "Create Input Table" to create an Input sheet summarizing the responses for Regression Analysis.
* Regression Analysis + & - table outputs included in the January 2026 release *
Here is the Same Example using a Full-Factorial
Input Table with Ratings in column R
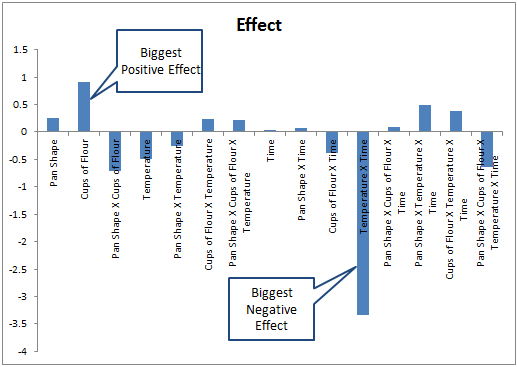
Analysis of Major Effects
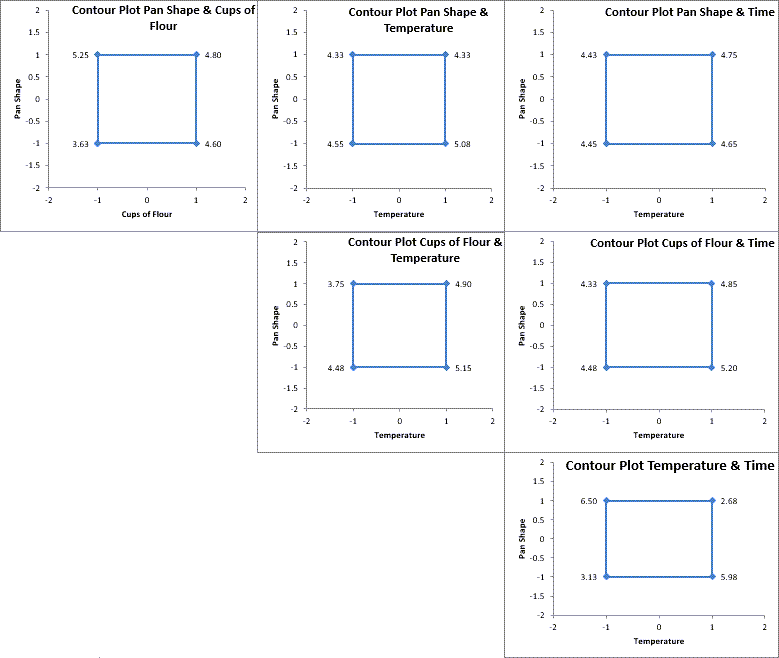
Contour Plot Outputs
Available in the following templates:
Full Factorial | Fractional Factorial 8-Run | Fractional Factorial 16-Run
Mean Plot Output
Available in the following templates:
L4 Taguchi | L8 Taguchi | Full Factorial | Fractional Factorial 8-Run | Fractional Factorial 16-Run
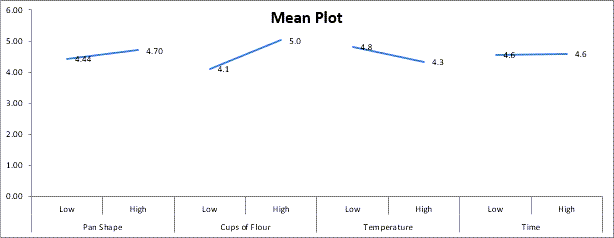
Plots of Factors Low-to-High

Analysis of Major Interactions
Design of Experiments Service Example:
You can even perform a design of experiments test in the service industries. People who send direct mail rigorously tally their results from each mailing. They will test one headline against another headline, one sales proposition against another, or one list of prospects against another list, but they usually only do one test at a time. What if you can't wait? By performing a Design of Experiments, you could test all of these factors simultaneously. Design your experiment as follows:
- Headline: Headline #1 (high), Headline #2 (low)
- Sales proposition: Benefit #1 (high), Benefit #2 (low)
- List: List #1 (high), List #2 (low)
- Guarantee: Unconditional (high), 90 days (low)
This way you might find that headline #1 works best for list #2 and vice versa. You might find that one headline works best with one benefit.
Performing a Design of Experiments can help you shorten the time and effort required to discover the optimal conditions to produce Six Sigma quality in your delivered product or service. Don't let the +/- arrays baffle you. Just pick 2, 3, or 4 factors, pick sensible high/low values, and design a set of experiments to determine which factors and settings give the best results.
Start with a 2-factor and work your way up. It's just not that hard, especially with the right software.
Want to Add a Transfer Function?
Using the Full Factorial, Fractional Factorial 8-run, and Fractional Factorial 16-run templates, you can manually calculate your Transfer Function!
For more information on how to do so, click here.
