Want to Show Process Changes on QI Macros Control Charts?
QI Macros Process Change Features Work on Control Chart Templates Too!
If you aren't sure where a change occurred, then use the Process Change Wizard!
It's easy to show process changes on a control chart created by QI Macros
Process changes on control charts are sometimes referred to as process phase, stages or stair steps. The procedure is slightly different depending on how you create your control chart. This page covers control chart templates. See this page for new and existing charts created with a macro.
Control Chart Templates
- Go to the chart and click on the first data point where the process change occurred:
Tip: The first time you click on a point, Excel will select the whole line. Click on the point a second time to select just the point. If you have done this correctly, Excel will highlight your point.
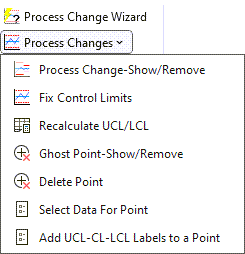
- Click on QI Macros chart menu, select the "Process Changes" drop-down and choose " Process Change-Show/Remove":
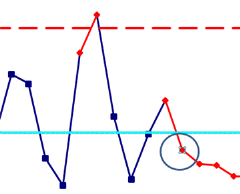
- The template will calculate a new set of control limits starting at the data point in the row you entered. On the X chart templates the process change will be reflected on the X and chart.
For XmR, XbarR, and XbarS charts, only utilize the Show Process Change functionality on the X charts - never on the R or S charts.
Note: You can perform more than one process change on a chart!
- Don't forget to rerun stability analysis using the new control limits. Click on the chart sheet and use the QI Macros menu to select "Analyze Stability."
Remove Process Change
*Functionality included in the 2022.10 version of QI Macros*
If you have inputted a process change and need to either remove the shift or put the shift in a different location:
- Click on the point where the process change has been implemented.
- And from the QIMacros Chat menu, click on the "Process Changes" drop-down menu and select "Process Change-Show/Remove".
- The process change will then be removed from your chart and your limits will be automatically recalculated!
NOTE: In versions of QI Macros prior to the 2022.10 release, if you wish to remove a process change from your data set, select the chart and choose "Recalculate UCL/LCL" from the "Process Changes" drop-down - this will reset all limit calculations and remove all process change(s). And once you have done so, click on your chart and select "Analyze Stability".
Stop Struggling with Control Charts!
Start creating your Control Charts in just minutes.Download a free 30-day trial. Get Control Charts now!
QI Macros Draws These Charts Too!
- Click on QI Macros chart menu, select the "Process Changes" drop-down and choose " Process Change-Show/Remove":

KnowWare International, Inc.
2696 S. Colorado Blvd., Ste. 555
Denver, CO 80222 USA
Toll-Free: 1-888-468-1537
Local: (303) 756-9144