Tools for Lean Six Sigma
Give me a lever long enough and I can move the world.
Gathering Numeric Data
- Are you gathering data that you can count, like number of people or defects? Yes
- Are you gathering data that you can measure, like money, length, weight, or time? Yes
Graphing Data
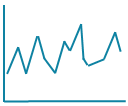
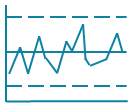
- Is your data measured periodically over time (minute, hour, day, project, event)?
Use a line graph - Are you using data to focus the improvement effort?
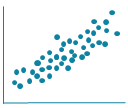
Use a Pareto Chart or pie chart - Are you trying to prove a cause-effect relationship between two variables (e.g., calories consumed and weight gain?
Use a Scatter Plot - Are you trying to determine the stability of the process?
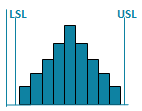
Use a Control Chart - Are you trying to determine the capability of the process?
Use a Histogram - Are you comparing data year over year or month over month?
Use a Bar Chart
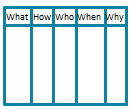
Organizing verbal or written data
- Are you trying to simplify a large number of written ideas?
Use a Affinity Diagram - Are you trying to determine the driving issues among the simplified data?
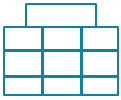
Use a Relationship Diagram - Are you trying to create links from higher level ideas or activities to more detailed ones?
Use a Tree Diagram - Are you trying to evaluate the relationship between two sets of tangible criteria?
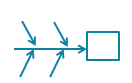
Use a Matrix Diagram - Are you trying to evaluate the possible failure or fault points?
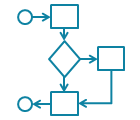
Use a PDPC Chart or EMEA/FMEA--Error Modes and Effects Analysis - Are you trying to create a sequence of activities?
Use an Arrow Diagram
Key Tools for Focusing The Improvement Effort
Tree Diagram

Line Graph
Pareto Chart

Key Tools for Improving the Process and Problem Solving
Cause Effect Diagram
Countermeasures
Action Plan
Additional Tools for Improving the Process
Systems Diagram

Scatter Diagram
Histogram
Key Tools for Sustaining Improvement--Process Management
Flow Chart
Control Chart
Histogram
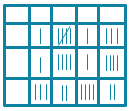
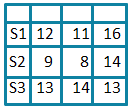
Tools for Data Collection
Check Sheet
Data Sheet
Matrix Diagram

Tools for Teamwork
Affinity Diagram
Relationship Diagram

Matrix Diagram
Do you need to:
