Looking for CAGE or KANO Templates in Excel?
QI Macros has Ready-Made Cage & Kano VOC Templates!
Why It Matters:
- A Voice of the Customer Matrix is used in the initial stages of process or product development. It is used to gather and document a customer's needs and wants.
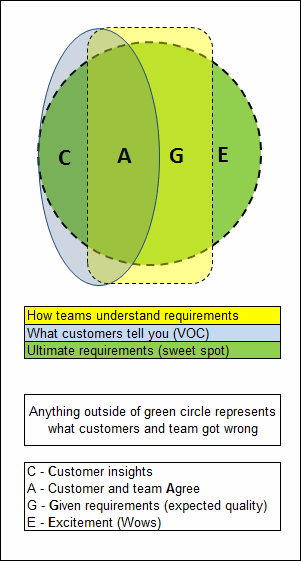
- The CAGE Model is used to visually represent what customers and/or team members got right and wrong about the ultimate requirements.
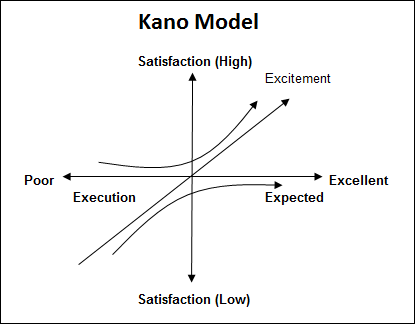
- The Kano Model is used to identify quality attributes within a design or system via a customer-survey approach. This leads to a better understanding of the customer's preferences. It is also used to plot Satisfaction vs. Execution.
Listen to our Cage & Kano Models podcast below!
* Generated using QI Macros' source material via an AI model *
Go Deeper: The CAGE Model
| C | Customer insights | Key insights discovered when researching requirements. |
| A | Customer & Team Agree | Requirements the team identified and customers verified during research. |
| G | Given requirements | Expected quality or features that are so obvious they are not usually even stated by customers. |
| E | Excitement (wows) | Elements of a product or service that customers don't even know they want. |
Example of the CAGE Model Template
How to Use QI Macros CAGE Model template
- Double-click each shape you wish to move and/or re-size, representing the following:
- How teams understand requirements
- What customers tell you (VOC)
- Ultimate requirements (sweet spot)
- Note that anything outside of green circle represents what customers and/or the team got wrong.
Go Deeper: The KANO Model
How to use QI Macros' KANO Model template
See example below for instructions on how to fill-out your KANO Model:
- Input your Attributes list in cells A2:A15.
- Have participant(s) complete the survey accordingly by responding with Q, M, O, A, I, or R for each question:
Questionable
Must-Be
One-Dimensional
Attractive
Indifferent
Reverse - Then, input the response totals for each value, in each row, in table B2:G15.
- The "Final Category" for each question (row) will be assigned automatically in cells H2:H15.
NOTE: The cell with the largest value in each row will turn yellow. This is the letter that will then be placed in the "Final Category." - "Category Strength" will be automatically calculated in cells I2:I15. And those cells will turn red if percentage is < 5%, while "Total Strength" will be calculated in cells in J2:J15 and those cells will turn green if the calculated percentage is > 50%.
- The "Better" and "Worse" values will then be plotted in the chart below the Attributes table:

- Lastly, click on each of the 3 arrows in the graph below to move and/or re-size at your discretion, to represent Satisfaction vs. Execution:

* Attributes Table and functionality included in the July 2025 version of QI Macros *
To access the voice of the customer matrix and templates for the Cage and Kano models, click on QI Macros menu > Planning & PM Tools > Voice of the Customer Matrix. Once you have opened the Voice of the Customer Matrix template, select the "CAGE Model" or "KANO Model" tab:
![]()
Haven't you waited long enough?
Start creating your Cage/Kano VOC in just minutes.
Download a free 30-day trial. Get the Cage/Kano VOC now!
The Cage/Kano VOC is one of many tools included in QI Macros add-in for Excel.
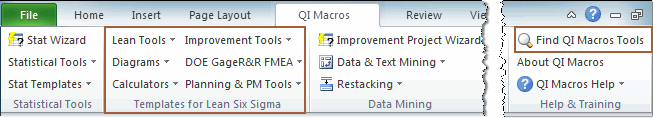
QI Macros adds a new tab to Excel's menu, making it easy to find any tool you need. If you can't locate a tool, use the find tools feature on the far right side of QI Macros menu.
Learn More...
- Voice of the Customer Matrix Template
- Voice of the Customer Matrix Example
- Voice of the Customer Matrix Video
