Tar Pits
Step 2
Have you stumbled into one of the tar pits of step two of the PROBLEM SOLVING PROCESS?
- Instead of a "fishbone" diagram, do you have a "whalebone" diagram--too many branches? This means that step one was not sufficiently stratified or focused. Go back a step and go one level deeper.
- Are your root causes not actionable? Did you solve someone else's problem or did you fail to dig deeply enough? Go to the end of each chain and ask "why" a couple of more times.
- Are some of the branches circular in logic? You failed to check logic of evolving diagram. After you ask "Why A?", check the logic by going back up: "Does B cause A?"
- Did you get all the way through results only to find that you have the wrong root cause? You failed to verify suspected root causes before going forward. Often, only one out of every five suspected causes will be the "root" cause of the problem. To prevent waste, always verify the root causes before continuing to step three.
Countermeasures
Select Countermeasures to Prevent The Problem
![]()
Step 3
Have you stumbled into one of the tar pits of step three of the PROBLEM SOLVING PROCESS?
- Did you verify the root causes? Verify them before you begin!
- Have you kept the sponsor informed of your progress and recommendations? Now is a good time to get their input to generate support. Solutions requiring budget will need approval.
- Have you identified alternative solutions and their relative cost/benefits? Inexpensive solutions often provide better results more quickly than expensive or complex technical ones.
- Have you developed and implemented an action plan that says who will do what when? Take the time to construct one and follow up on implementation, otherwise nothing gets done.
Results
Analyze the Results of Implementing the Countermeasures
Step 4
Have you stumbled into one of the tar pits of step four of the PROBLEM SOLVING PROCESS?- Have you verified that the solutions applied reduce the verified root causes?
- Have you checked to see if you reached your target for improvement? If not, are there additional solutions you could implement based on what you've learned?
- Have you celebrated the success you've accomplished?
Sustain the Improvement
Implement a System to Sustain the Improvement.
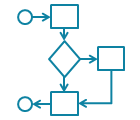
Flow Chart
Control chart

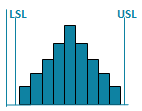
Histogram
Have you implemented a process management system to sustain the new level of excellence?
Are you having trouble with one of the tools of standardization?
Step 5
Have you stumbled into one of the tar pits of step five of the PROBLEM SOLVING PROCESS?- Have you revised the process flow, methods and procedures to reflect the improvement so that everyone can benefit from the change? Flow chart the revised process.
- Have you implemented measurements and follow up to ensure that the improvement becomes an integrated part of daily work? Develop control charts.
- Have you identified all the ways this improvement can be replicated or modified for adoption in other areas of the business? Develop an action plan to multiply your gains!
Future Plans
Select Next StepsAre there more possibilities to analyze using the data from step four? Write a new problem statement.
Can you go back to step three to select additional solutions? Implement additional solutions.
- Can you go back to step two to identify additional root causes?
- Is it time to change team members?
- Is it time to disband after a celebration for a job well done?
Why wait? Start creating these charts and diagrams in seconds using
QI Macros add-in for Excel.
Why wait? Start creating these charts and diagrams in seconds using
QI Macros add-in for Excel.
