Not Sure How to Write a Good Problem Statement?
Problem Statements are Easy using QI Macros Simple Template!
The Analysis phase of any improvement project depends on a good problem statement to drive the root cause analysis. Writing a good statement of the problem is easy if you have analyzed the data using one or more Pareto charts.
Use this simple template for your problem statement:
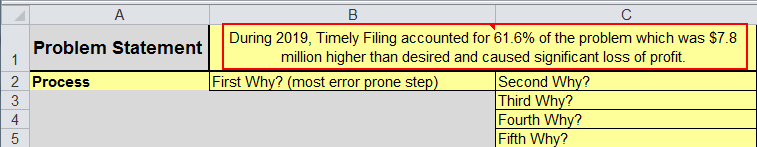
During (time), (big bar on Pareto) accounted for XX% of problem which was X higher than desired and caused customer dissatisfaction.
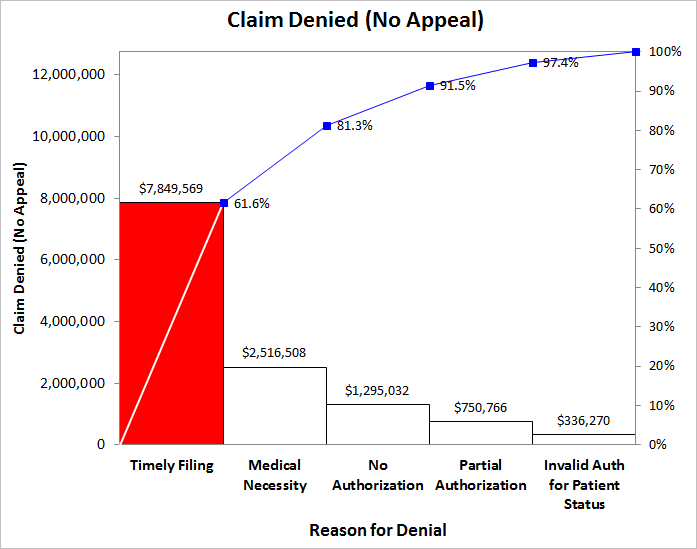
So the problem statement for the Pareto chart below would be:
During 2019, Timely Filing accounted for 61.6% of denied insurance claims which was $7.8 million dollars higher than desired and caused significant loss of profit.
Pareto Charts Help You Focus on the Right Problem
Pareto charts narrow the focus to a few "big bars". Each big bar can become a good problem statement. In the Pareto chart below, Timely Filing is the "big bar".
Fishbone Diagrams Help Get to the Root Cause of the Stated Problem
The first row of QI Macros fishbone diagram template contains an outline for any problem statement. As discussed above, use the data from your Pareto chart to populate the problem statement. Then use the fishbone to get to the root cause.