Need to Transform Non-Normal Data using Yeo-Johnson Transformation?
QI Macros can run a Yeo-Johnson Transformation on your data in seconds!
Yeo-Johnson Transformation uses a statistical calculation to transform non-normal data to a normal distribution so that additional analysis can be performed. While this transformation is designed for numerical data, said data can contain positive AND negative values.
NOTE: The proper Lambda will be chosen automatically to provide the best normal distribution output.
Listen to our Yeo-Johnson podcast below!
* Generated using QI Macros' source material via an AI model *
Yeo-Johnson Transformation Example Using QI Macros for Excel:
- Click and drag over your single-column set of data to select it:

- Click on the QI Macros menu > Statistical Tools > Transformations > Yeo-Johnson:
- QI Macros will automatically transform your data and provide you with a Histogram, BoxPlot, Confidence Intervals, and Tolerance Limits, as well as Probability Plot outputs:

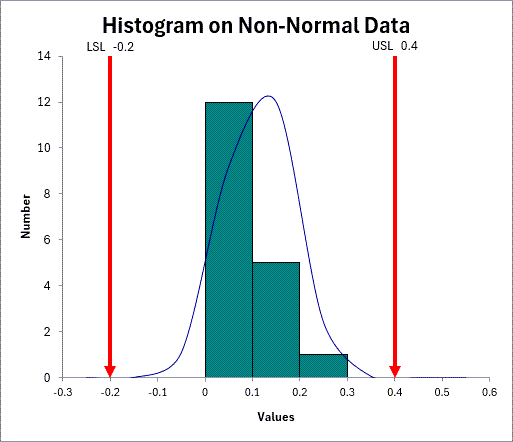
If we ran a histogram on the before and after data sets we can compare the non-normal and normal distributions.
Non-Normal Data
Normalized Data


NOTE: If you have multiple columns of data, all rows need to be equal. If they are not, you would instead need to either run transformation on each column separately or place all data into (1) column.
Starting with the 01.2026 version of QI Macros, users can run transformation on unequal rows of of data .
*Included in the 07.2024 version of QI Macros*
Lambda Value Output
The Lambda value is chosen based on the apex of your given p-value. With that, the tool looks for the highest p-value that gives you the most normal transformation.
And once the Transformation has found that apex, it then assigns the Lambda value accordingly.
In the table below, in cells S2:T4, we show that if the Lambda value is changed to (1), the calculated p-value is 0.856369:
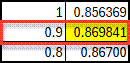
If we change Lambda to (.9), the p-value is 0.869841, while Lambda as (.8) shows the p-value as 0.86700.
In the example above, the table shows the p-value's apex is 0.869841, and therefore the Transformation's Lambda value is 0.900.
