Struggling to Run a Two One-Sided Equivalence Test (TOST)?
QI Macros can run an Equivalence test (TOST) in Excel for you!
Listen to our Equivalence TOST Test podcast below!
* Generated using QI Macros' source material via an AI model *
When to use an Equivalence Test
Traditional t-Tests determine if means are the same or different, but they can have false positives. Equivalence testing determines an interval where the means can be considered equivalent.
The Equivalence (TOST) Test uses two t-tests assuming equal variances with a hypothesized mean difference (u1-u2 = interval).
Equivalence Test Example
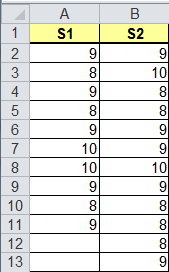
Adhesive tape is measured immediately after production and 24 hours later. Are the measurements equivalent at these two different points in time? If they are, one measurement can be eliminated, saving time and money.
Run an Equivalence (TOST) Test Using QI Macros
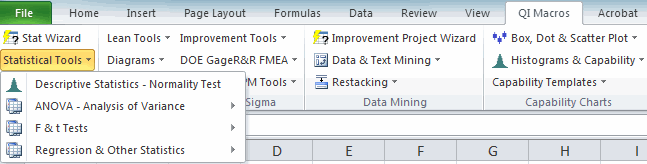
Select the data within your Excel spreadsheet, click on the QI Macros menu > Statistical Tools > F & t Tests, and select Equivalence (TOST) Test:
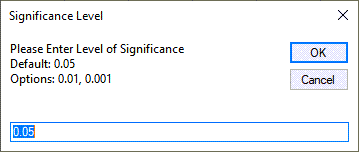
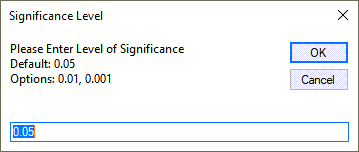
QI Macros will prompt for a significance level (default = 0.05 or 0.95):
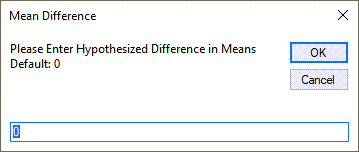
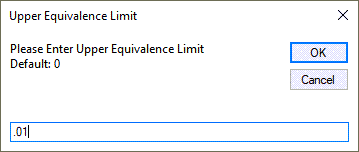
Along with the hypothesized mean difference. Default = 0:
QI Macros will perform the calculations and interpret the results for you!
If the +/-% is 5% (0.05), the means are not equivalent. At 10%, they are equivalent.
If both p-values are less than 0.05, the means are equivalent.
If both p-values are greater than 0.05, the test cannot conclude means are equivalent.
Note: You can change the UEL/LEL and any other cell in yellow to adjust the calculations.
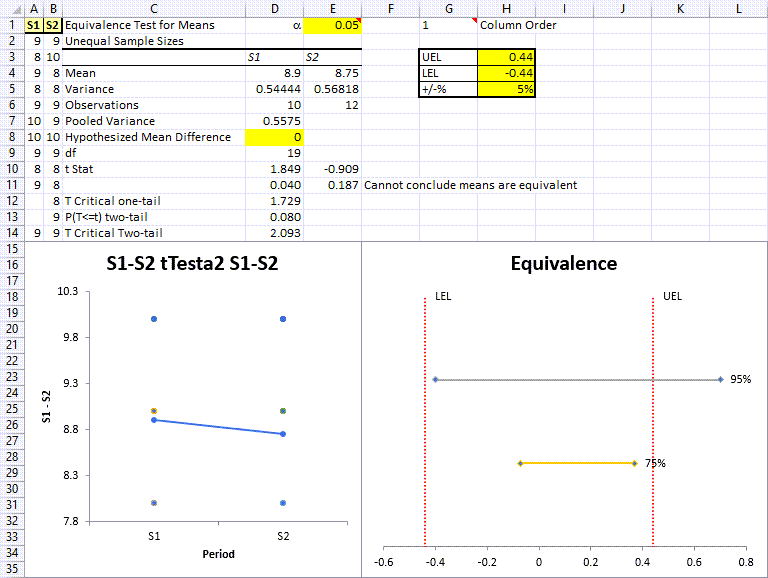
The equivalence test results include a Values Plot along with an Equivalence Plot.
Releases prior to July 2022 included a Box and Whisker Plot.
Now here's where it gets interesting...
Because the one-tailed p-values are both less than 0.05...the means can be declared equivalent.
So, we can eliminate one of the tests.
Define the two null and alternate Hypotheses for equivalence:
- The null hypothesis H01 is that the mean difference (x1-x2) <= 0.8
- The alternative hypothesis H11a is that the mean difference > 0.8
- The null hypothesis H02 is that the mean difference (x1-x2) >= 0.8
- The alternative hypothesis H12a is that the mean difference < 0.8
When to use an Equivalence (TOST) Test for Paired Data
This test is used when trying to assess whether the mean difference between paired observations lies within the pre-determined level of equivalence.
If it is determined that the two observations do not differ by a significant amount, this test will prove that the two observations are acceptable as paired data. If, however, they differ significantly from each other, than this test will prove that the two observations are NOT acceptable as paired data.
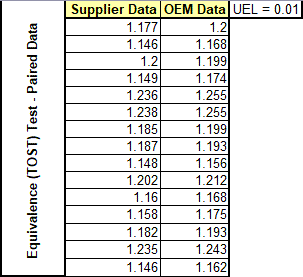
Equivalence (TOST) Test for Paired Data Example
You would like to compare measured data from your Supplier vs. measurements taken by the Original Equipment Manufacturer (OEM):
Run an Equivalence (TOST) Test - Paired Data Using QI Macros
Select the data within your Excel spreadsheet, click on the QI Macros menu > Statistical Tools > F & t Tests, and select "Equivalence (TOST) Test - Paired Data":
NOTE: To successfully perform this TOST Test, both columns of data MUST have equal sample sizes.
QI Macros will prompt for a Level of Significance (default = 0.05 or 0.95, and Options = 0.01, 0.001):
Along with the Uppler Equivalence Limit (UEL). Default = 0:
You will then be provided with an Equivalence (TOST) Test - Paired Data output:
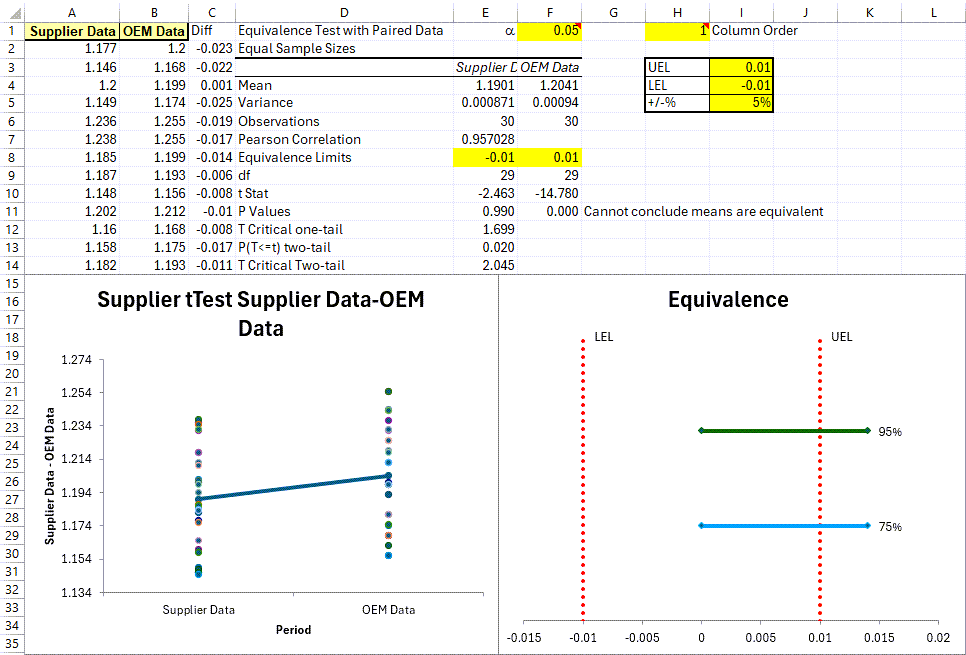
The results above include a Values Plot along with an Equivalence Plot, and indicate that the (2) data set means are NOT Equivalent.
Can conclude that Means are Equivalent, because p1 & p2 are less than Alpha Value (.05, .01, 0.001)
Cannot Conclude that Means are Equivalent, when p1 & p2 are greater than Alpha Value (.05, .01, .001)
* Enhancement introduced in the April 2024 release of QI Macros! *
Equivalence Plot
UEL (Upper Equivalence Limit ‐ upper limit of acceptability for the difference) and LEL (Lower Equivalence Limit ‐ lower limit of acceptability for the difference) are based off the sum of the 2 data sets' means, divided by 2, and multiplied by the +/‐% value found in cell H5 (this value affects the width of UEL/LEL).
The UEL, LEL, and Confidence Interval CAN BE UPDATED BY THE END USER in cells H3:H5 accordingly. And if the UEL and LEL are updated, the Confidence Interval lines and Equivalent/Not Equivalent statements will update automatically, based upon your data set.
NOTE: End users can also manually enter the Hypothesized Mean Difference (HMD). If the HMD is any # other than 0, both the UEL and LEL will be updated to match the positive and negative HMD values (added in the July 2023 version of QI Macros).
95% line output represents your 95% Confidence Interval and since it is partially located outside of the Zone of Equivalence, this indicates that your data set statistically CANNOT claim equivalence.
75% line output represents your 75% Confidence Interval. And per information provided above, since it IS located w/in the Zone of Equivalence, if the end user chooses to use only a 75% Level of Confidence benchmark, their data set CAN statistically claim equivalence
