Need the Percentile Values of Your Data?
QI Macros can calculate them for you!
What are they?
Percentile Values indicate the position of a data point within your distribution. For instance, the 90th Percentile is the value below which 90% of your data falls.
How do I calculate them?
To calculate your Percentile Values with QI Macros, follow the steps below:
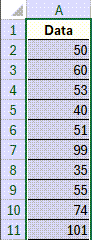
- Select your Data:
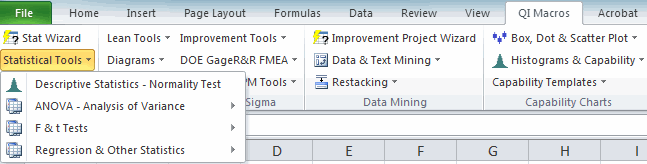
- Next, run "Descriptive Statistics - Normality Test":
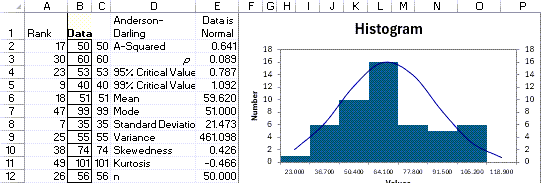
- Your Descriptive Statistics output will be automatically generated:
- Then, you will find a list of calculated Percentile Values either directly behind or to the right of your Descriptive Statistics charts! The Percentile values provided will range from from (1) to (99):
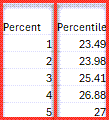
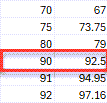
In the example listed below, we see the 90th Percentile value:
* Functionality included in the January 2026 release *
How do I add Percentile Values to a Control Chart?
If you would like to add a Percentile Value (e.g. 90th Percentile) to a Control Chart, follow the steps below:
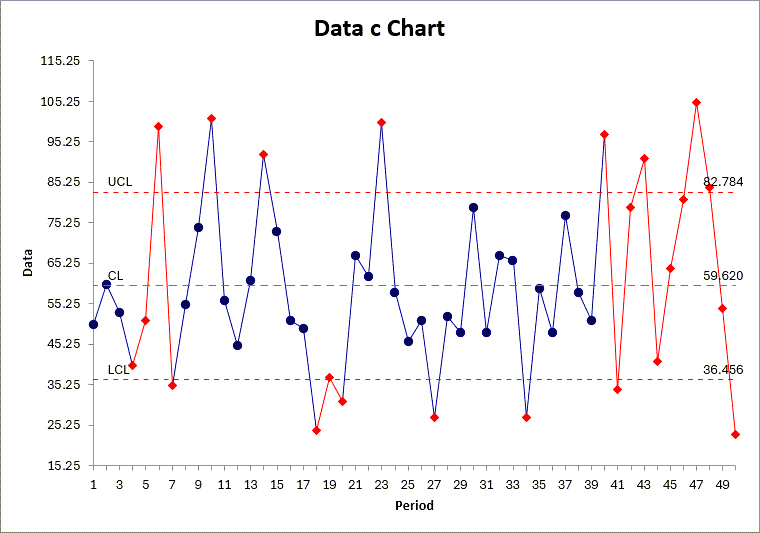
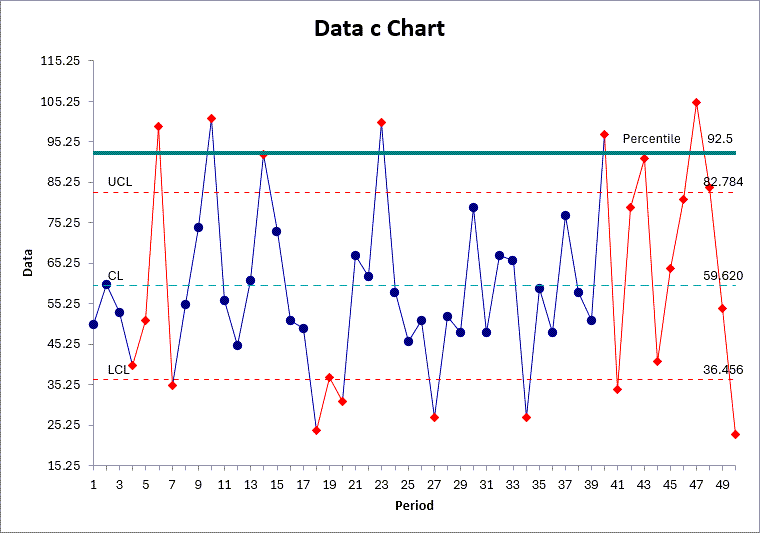
- Generate a Control Chart using QI Macros! In this example, we have created a c Chart, because our sample shown above is a single-column set of non-decimal data:
- Next, locate the calculated Percentile Value in the list from your Descriptive Statistics output:
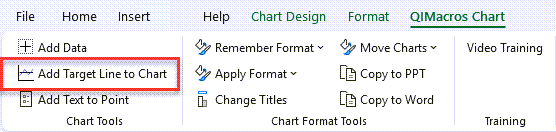
- Click on the Chart and use the "Add Target Line" tool from the "QIMacros Chart" menu:
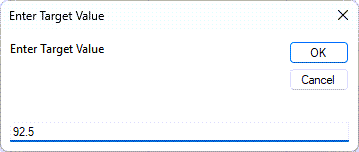
- Lastly, input your Percentile Value:
- A Target Line has now been added to your Control Chart - this represents your Percentile Value:
* Functionality included in the January 2026 release *
Save yourself time and frustration, use QI Macros for your statistical needs.
