Should You Use Run Charts or Control Charts?
QI Macros makes it easy to draw both in Excel - so use control charts.
The Evolution of Time Series Analysis From Run Charts to Control Charts.
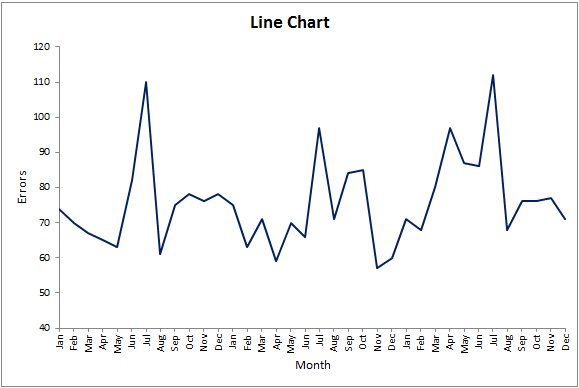
First there were Line Graphs:
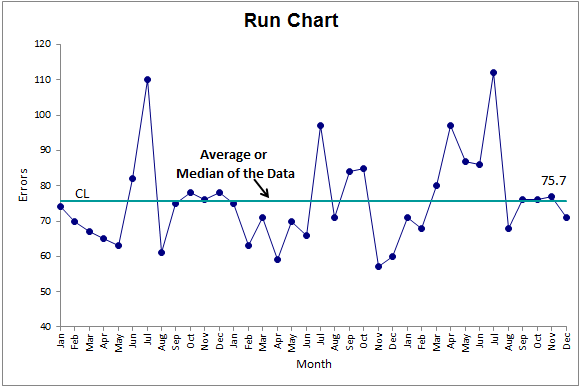
Then came Run Charts with an average or median center line:
Then came the Control Chart
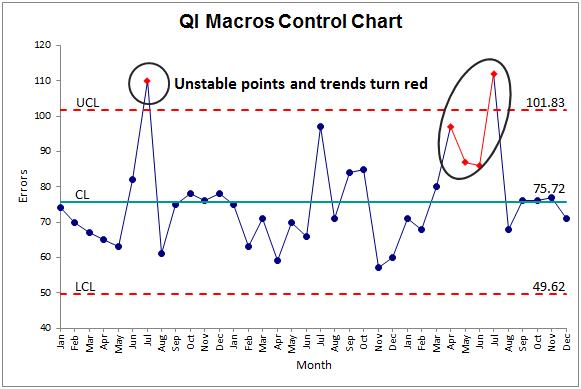
Control Charts are Smart Charts!
Control charts not only display your data, but they analyze it too.
Control charts calculate a center line and control limits. As your data is compared to the control limits, built-in rules pinpoint performance problems.
These points and trends are highlighted and should be investigated.
Since QI Macros can create control charts for you in seconds, there's no reason to settle for primitive line and run charts. Use the "advanced technology" of control charts and spend time analyzing your data, not just drawing charts.
Download our FREE Evolution of Business Charts Blueprint - Click Here
Stop Struggling with Control Charts!
Start creating your Control Charts in just minutes.
Download a free 30-day trial. Get Control Charts now!
QI Macros Draws These Charts Too!
