Don't Miss Out on the Latest QI Macros Features
Check Your Version and Upgrade to QI Macros 2024
A Lot Can Happen in a Year or Two or Three...
At least once a week, we get a call from a customer who says they just bought QI Macros a year or two ago. However, when we find them in our system, they are surprised to learn its been three, four or even five years.
If your QI Macros is a couple of years old, wow, have you been missing out!
QI Macros is regularly enhanced based on customer feedback and industry updates.
Enhancements include:
- New Charts, Templates and Tools
- New Features to Save You Time
- Updates to be consistent with industry standards like the AIAG, Joint Commission on Healthcare, IHI etc.
- Updates to remain compatible with the latest Microsoft Windows and Excel updates
I finally got QI Macros 2021 yesterday! OMG amazing!!!! Big improvement from 2017!!
Improvement Advisor at Kaiser Permanente
QI Macros Users - Good News!
You are eligible to upgrade to QI Macros 2024 for $175 USD.
Order Your Upgrade Now
Download Only
$175 USD
1 user
1 computer
Download immediately
Make a backup
Item # W232
QI Macros 2024 is Compatible with:
- Excel 2013-2021/Office 365 (PC) | 2019-2021/Office 365 (Mac)
- Windows 8, 10, and 11 (PC) | macOS (Mac)
Find out which operating systems and versions of Excel your QI Macros license is compatible with.
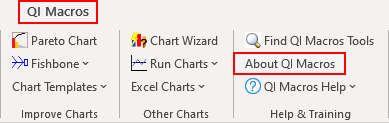
Not sure which licensed version you have?
QI Macros menu will tell you the year and if you click on About QI Macros you can find out the month and year:
1. Click on QI Macros menu and then on About the QI Macros:
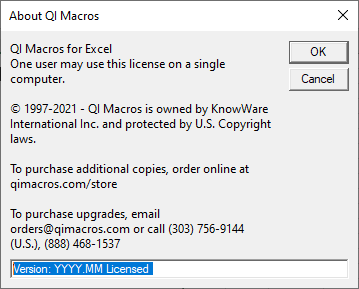
2. A window will open which indicates the Year and Month you purchased in YYYY.MM format:
QI Macros Enhancements - What Are You Missing?
QI Macros Version # |
Description of Enhancements |
|---|---|
2024.04 |
|
2024.01 |
|
2023 |
Highlights30-60-90 Day Action Plan added to Action Plan Binomial Capability Analysis and Poisson Capability Analysis added to Capability Templates Binomial Logistic Regression added to Logistic Regression Multinomial Logistic Regression added to Logistic Regression Bollinger Bands Chart added to Control Chart macros Driver Matrix added to Tree Matrix MANOVA One-Way macro added to Statistical Tools RACI template added to SWOT template Replace Zeros with Blanks added to Restacking functionality Variance Inflation Factor (VIF) added to Multiple Regression XmR multiple column option added to XmR Chart macro |
2023.10 |
|
2023.07 |
|
2023.04 |
|
2023.01 |
|
2022 |
Highlights"Remove" option added to Process Change and Ghost Point Show/Hide Rule Numbers gives end user Control Chart Rule descriptions Revamped Process Change and Fixed Control Limits functionality Value Stream Map now allows up to 108 Steps/Processes Mood's Median Test added to Non-Parametric templates Equivalence Plot added to the Equivalence (TOST) Test output AutoCorrelation added to Statistical Tools XmR Autocorrelated added to Control Charts Logistic Regression (Binary) added to Statistical Tools Honest Gage R&R added to Gage R&R MSA 4th Turtle Diagram template added |
2022.10 |
|
2022.07 |
|
2022.04 |
|
2022.01 |
|
2021 |
HighlightsQI Macros Control Chart Wizard now provides a Control Chart Template in the output Data Mining Wizard renamed and packaged as "Improvement Project Wizard" XmR Multi-Column Chart added XbarS 500 Skyline and XmedianS 500 templates added Stack Columns with Blank Rows added |
2021.10 |
|
2021.07 |
|
2021.04 |
|
2021.01 |
|
2020 |
HighlightsRemember and Apply Custom Chart Format added Weighted Pareto Chart Template added Quadrant Bubble Template and Quadrant Bubble Macro added Quadrant Scatter Template and Quadrant Scatter Macro added Filter/Unfilter Chart functionality added Added Multipliers to p Charts and u Charts - changes rate levels of y-axis values Updated centerlines to dashes, when the Fix Control Limits function is used Reset Skyline Limits functionality added |
2020.10 |
|
2020.07 |
|
2020.04 |
|
2020.01 |
|
2019 |
Highlights FMEA 5th Edition Template added (AIAG & VDA FMEA 1st Edition) |
2019.10 |
|
2019.06 - 2019.09 |
|
2019.04 - 2019.05 |
|
2019.01 |
|
2018 |
HighlightsAutomated Value Stream Map |
2018.10 |
|
2018.07 |
|
2018.04 |
|
2018.01 |
|
2017 |
HighlightsData Mining Wizard 2.0 (Feb 2017) Fix Control Limits added to Control Charts |
2017.10 |
|
2017.09 |
|
2017.07 |
|
2017.06 |
|
2017.04 |
|
2017.02 |
|
2017.01 |
|
Prior Years |
Order Your Upgrade Now
Download Only
$175 USD
1 user
1 computer
Download immediately
Make a backup
Item # W232
Join 100,000+ Users
in 80 Countries
![]()

KnowWare International, Inc.
2696 S. Colorado Blvd., Ste. 555
Denver, CO 80222 USA
Toll-Free: 1-888-468-1537
Local: (303) 756-9144