Shortcut to Results - Data Mining and Analysis Service
We'll Find the Hidden Improvement Project Lurking in Your Data!
Struggling to Get Results from Six Sigma?
Have you been struggling to turn data into actionable improvement projects? Is the boss wondering when he or she will see some results?
Let Jay be your short cut to dramatic improvements.
If you are neck deep in Excel data about defects, mistakes, errors, lost profit, missed opportunities, but:
- You've tried, and can't figure out what to do with it or...
- You don't have time to analyze it, but someone's breathing down your neck to find and fix the operational problems that are squeezing profit margins or...
- You're struggling with daily firefighting and crisis management caused by defects, mistakes, or errors...
Jay can analyze your data and quickly tell if there's an improvement project lurking in your data. Jay uses Lean Six Sigma to find fresh solutions to seemingly unsolvable problems and generates ideas that surprise people with a new perspective.

Jay has been doing this for decades. He can spot problem patterns in your data easily and quickly turn them into actionable improvement stories. And it doesn't take him weeks or months like it might take a novice improvement team. He can do it in a matter of hours; he's done it consistently and dependably over time.
Best of all, he can show you how he did it!
Here's How It Works
- If your data is in a financial system, SAP, medical records or other big system, export the data about defects or deviation into an Excel workbook.
-
Then send us your Excel workbook (one worksheet) with a description of the issue you're trying to resolve. We won't share your data with anyone and we're happy to sign a non-disclosure agreement. Your Excel data can be text and numbers that look like this - Ent (Where), Adm Date (When), AS/FC/IN1, PT (What), Charges (How Much):
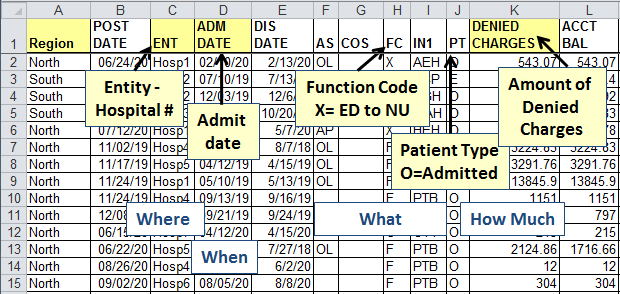
(At a minimum, you will need the When, Where, and What of type of defects. If you have the How, How Much, Who and any Whys, that would be helpful.) Please include a description of the columns in your file and include the meaning of any acronyms (e.g., What does "ENT, "OL" or "AS" mean? Use Excel comments to explain each heading for each column.)
Warning: No PDFs, No Word Docs, No Text files. Only single worksheet Excel .xlsx or .csv files will be accepted.- Worksheets must be raw data about individual defects, mistakes and errors. Summarized data is unacceptable.
At a minimum, it must have the when, where, what (optional: how, who, how much). - Each column of data must have a heading with a comment explaining the contents of the column.
- Columns cannot contain multiple types of data - text and numbers - (e.g., "John 30 defects")
- Files must have only the one worksheet (.xlsx or .csv)
- In other words, clean your data before you send it or it won't be accepted: No exceptions.
- Worksheets must be raw data about individual defects, mistakes and errors. Summarized data is unacceptable.
- We will analyze the data using QI Macros Improvement Project Wizard. The cost for this service is $297 per worksheet. The Improvement Project Wizard may reveal one or more projects in your data. Most improvement projects have three main deliverables:
- If you would like Jay to analyze your results and create recommendations for action, that will be an additional $400.
- If you want Jay to walk you through his analysis online so that you can see every step, that's an additional $500.
That way, you can see how the project developed and learn how to do it yourself.
- You convene a team to analyze the root causes of each problem and initiate improvements. (Tip: Jay has found that it's impossible to choose the ideal members for a team until these three steps have been completed.)
Your Investment
If you bring Jay in for a workshop, it costs $10,000 or more.
- Data Analysis of a Single Worksheet with Consultation: $997 with Jay's recommendations and an online consultation with Jay about your data and projects.
- Data Analysis of a Single Worksheet: $497 with video recommendations from analysis of the results.
- Analysis of a Single Worksheet using the QI Macros Improvement Project Wizard: $297
- Still not sure if it's right for you? Send your Excel data file to support(at)qimacros.com with a written description of your challenge. We will let you know which one of these options will help. (We will also let you know if they won't.)
Unconditional Money Back Guarantee
If you aren't satisfied with the data analysis for any reason, we won't charge you a penny or we'll refund your money... no questions asked.
After struggling for weeks trying to figure out how to turn a year's worth of costly penalties into an actionable improvement story, I hit a wall and called Jay. In a couple of days, he helped us figure out how to:
- Use Excel's PivotTables to organize and summarize our data,
- Convert it into Pareto charts that identified one product as two-thirds of the problem,
- Use Pareto charts to show which elements of the business weren't a problem so that we didn't waste time,
- Add Fishbone diagrams with problem statements ready for root cause analysis,
- Identify additional areas for data collection and analysis.
Using Jay helped us jump the learning curve and get right into root cause analysis. We're excited because this improvement will add as much as $500,000 to the bottom line. I'd recommend Jay to anyone who's staring at loads of complex data and wondering what to do next.
- Kim
What's it costing you to NOT hire Jay's analysis skills as a shortcut to your success? Contact us to start your Shortcut to Results Analysis.
Join 100,000+ Users
in 80 Countries
![]()
