Looking for Lean Six Sigma Templates in Excel?
QI Macros add-in has the tools and templates you need!
Spend more time solving problems and less on LSS project documentation.
QI Macros contains more than 140 time-saving fill-in-the-blank templates including the automated fishbone diagram.
QI Macros adds a new menu to Excel
To create a fishbone diagram:
- Select fishbone on QI Macros menu.
- Enter your text into the template.
- Click the "Create Fishbone" button and QI Macros does the rest!
Lean Six Sigma Templates in QI Macros Excel add-in
Lean Six Sigma templates are found in a few different places on QI Macros menu. Control Chart, Capability Analysis and Statistical templates are organized with their corresponding macros. The Lean Six Sigma templates and tools are located together and organized by major category.
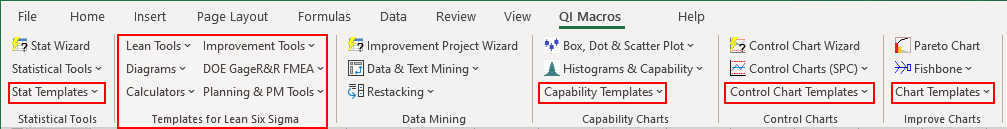
To open up any QI Macros template, just click on the QI Macros tab and then the template you want.
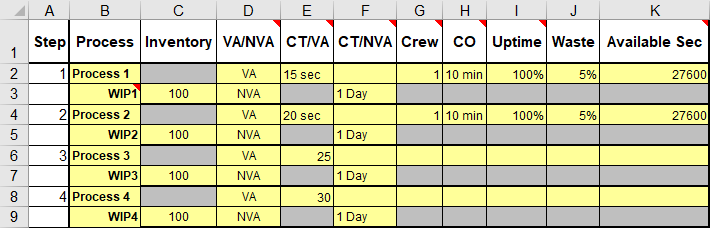
- All input areas are shaded in yellow for easy identification.
- Gray shaded areas are calculations that you generally want to stay away from.
- Many templates are made up of several worksheets, so take a look at the worksheet tabs to see all of your options.
Some templates use Excel's drawing tools, some are pre-formatted forms to help you create documents, some are input forms that automatically create charts and some are powerful calculators that perform analysis like Gage R&R and DOE studies.
Some examples of QI Macros most popular templates
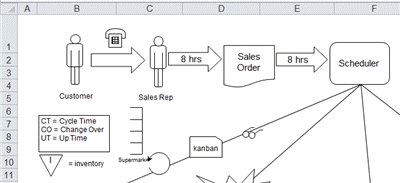
Automated Value Stream Map
Just type your data into the VSM Text tab:
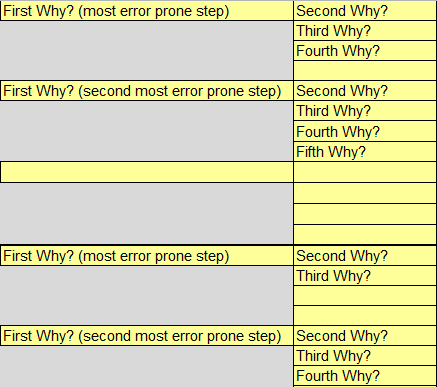
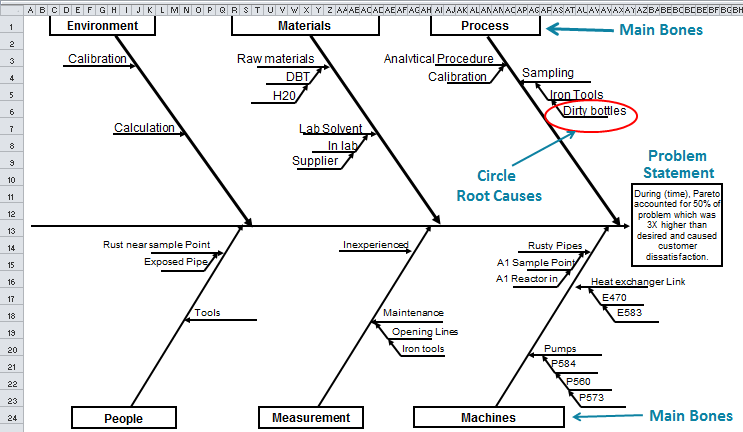
Automated Fishbone Diagram
Just type your "whys" into the yellow shaded areas and then click the create fishbone button and QI Macros draws the fishbone for you.
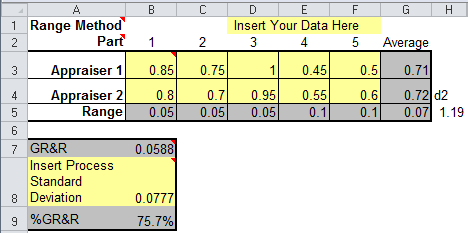
Gage R&R Template
Input areas are shaded yellow.
Calculations are shaded gray.
Hover over red triangles in top right of a cells for formulas, additional instructions and tips.
Special Features in QI Macros Templates
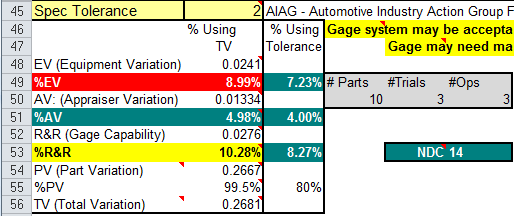
- Color Coded Results: In addition to the color coded input and calculation areas, QI Macros templates also use color to communicate results. Here is an example from the Gage R&R template.
Green: Good | Yellow: Warning | Red: Needs Attention:
- Visible Formulas: The formulas for each calculated cell are visible to you in Excel's formula bar.
- Common Data Tabs: where appropriate (i.e. PPAP forms, FMEA forms), we have added a tab for common data. Enter part #s, supplier name, process description, etc once and all other tabs are linked and updated.
- Instruction Tabs: Each template contains an instructions tab.
Start using Lean Six Sigma Templates in just minutes.
Download a free 30-day trial. Access any template immediately!
Why choose QI Macros for your process improvement needs?
![]()
Fast and Easy to Use
- Works right in Excel
- Create charts in seconds
- Easy to customize & share charts
- Free Training Anytime
![]()
Proven and Trusted
- More than 100,000 users
- In More than 80 countries
- Five Star CNET Rating - Virus free
![]()
Affordable
- Only $369 USD
Quantity Discounts Available - No annual subscription fees
- Free technical support
