Looking for an Overall Equipment Effectiveness Calculator in Excel?
QI Macros add-in has a ready-made OEE template for you.
What is OEE?
QI Macros OEE template provides you with a percentage that represents a “best practices” metric. This metric informs you of how productive your planned production time is:
- 100% OEE = This represents a perfect production time where you are only producing good parts with no downtime, as quickly as your production line allows.
- 85% OEE = High-level production and is widely acceptable.
- 60% OEE = Standard OEE score, however indicates that there are significant opportunites to improve your production.
- 40% OEE = Low OEE score, however indicates that you are at the beginning stages of improving your process. And given how low the OEE score, it will be quite easy to improve your production by identifying your largest source of downtime!
NOTE: OEE can be utilized as a "benchmark" and as a "baseline."
As a benchmark, use OEE to compare the performance of your production to industry standards. You can also compare your production to similar productions within your system, as well as to different shifts working on the same production.
And as a baseline, use OEE to track improvement and historical data used to eliminate waste for a specific production.
How to Use QI Macros Overall Equipment Effectiveness Template in Excel
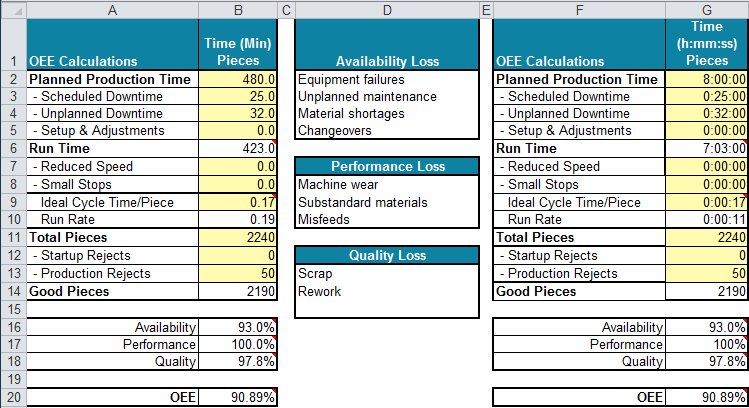
Input areas are shaded in yellow and represent the following:
- Planned Production Time = How long is your production time per Minutes/per h:mm:ss?
- Scheduled Downtime = How long do you plan to have scheduled downtime during your production?
- Unplanned Downtime = What is your estimate for unplanned downtime during your production?
- Setup & Adjustments = How much time will you allot for setup? And estimate amount for adjustments during your production?
- Reduced Speed = During your production, were there any moments where production slowed down?
- Small Stops = During your production, were there any moments where production stopped for a short period of time?
- Ideal Cycle Time/Piece = 10 seconds = 10/60 seconds/min
- Total Pieces = How many pieces are your creating in your entire production?
- Startup Rejects = How many rejected pieces did you have at startup?
- Production Rejects = How many rejected pieces did you have during your production?
When you input these items, the OEE template performs the calculations and displays these metrics in cells B(G)6, B(G)10, B(G)14, along with B(G)16:B(G)18 and B(G)20:
- Run Time: Planned Production Time - Downtime - Setup
- Run Rate: Run Time/Total Pieces
- Good Pieces: The total number of pieces in your entire production that are considered "good"
- Availability: Run Time/(Planned Production Time - Scheduled Downtime)
- Performance: (Ideal Cycle Time * Total Pieces)/Run Time
- Quality: Good Pieces/Total Pieces
- OEE: 85% or better is considered "World Class"
QI Macros OEE Calculator in Excel
The OEE template is one of many tools in QI Macros add-in for Excel. QI Macros installs a new menu on your Excel tool-bar. To access the OEE calculator, just click on QI Macros, then Calculators, and then "DPMO | Yield | Cp/PPM | OEE":
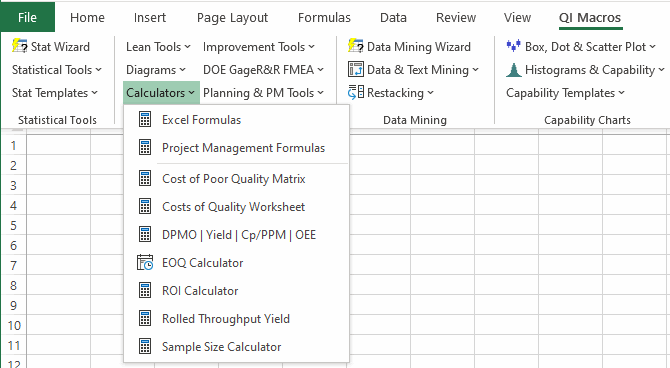
A template will open with the following worksheet tabs:

Learn More...
- Rolled Throughput Yield template for more than one process step.
- Cp Cpk Cpm calculator
- Taguchi loss function
