Struggling to Draw a Box and Whisker Plot in Excel?
QI Macros can draw a Box and Whisker Plot for you in seconds.
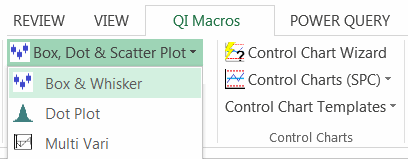
Draw a Box & Whisker Plot using QI Macros:
- Select your data.
- Select Box, Dot & Scatter Plot > Box & Whisker from QI Macros menu.
- QI Macros will do the math and draw the graph for you.
What is a Box and Whisker Plot? What is it used for?
Box and Whisker Plots (Box Plots or Boxplots) are like simple histograms turned on their side. Use them to analyze the variation between data sets. Box Plots allow you to easily compare medians between data sets (where the color changes in each box) and the variation within each dataset (i.e. how tall is the box and how long are the whiskers).

I just made my first charts and QI Macros were very easy and user friendly. This is going to be a great tool.
- Jim Welsh
Lennox Industries
What does each part of a box and whisker represent?
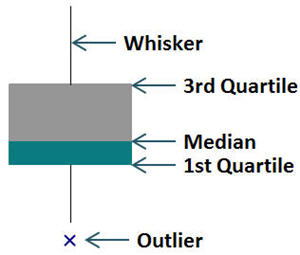
The box represents the distance between the 1st and 3rd quartiles--the InterQuartile Range (IQR=Q3-Q1).
For quartiles, there are three points: the first middle point (the median), and the middle points of the two halves. These three points divide the entire data set into quarters.
The whiskers are 1.5*IQR or the highest / lowest point within the range.
Outlier points are those that are greater than 1.5*IQR, from Q1 or Q3.
Source: Juran's Quality Handbook, Joseph M. Juran, Joseph A. DeFeo.
What to look for:
- If the box is all gray, then there is no difference between the 1st quartile and the median.
- If the box is all green, there is no difference between the 3rd quartile and the median.
- If your median value is less than 0, the boxes will indicate this by swapping order (green on top and gray on bottom).
Why use QI Macros to create Box and Whisker Plots?
Save Time - Draw Charts in Seconds
You don't need to learn a bunch of formulas or a separate software application. QI Macros works right in Excel.

Easy to Use
QI Macros is point and click simple. Just select your data and then select QI Macros from the tab we install on Excel's menu. Then select Box and Whisker Plot.
Look Like an Expert
Be ready to answer - "How did you do that?"
What your organization has done with the excel macros is great. It saves me a lot of time by not having to create the formulas and links. Your QI Macro's are better than most SPC specific software on the market. I have been using your macros since 1997.
- Chuck Whitaker
Nishikawa Standard Co.
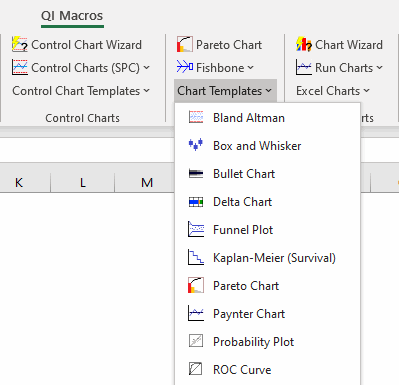
Want to generate a Box and Whisker Plot using a template?
If you would like to create a Box and Whisker Plot using a QI Macros template, click on the QI Macros menu and then select Chart Templates > Box & Whisker:
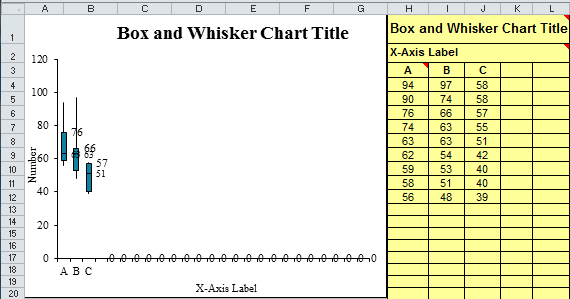
Once you have opened the template, follow the instructions below:
- First, input your Chart Title in cell H1
- Next, input your X-Axis Label in H2.
- Lastly, input your data set, starting in cell H4 - your chart will update automatically:
Stop Struggling with Box Whisker Plots!
Start creating your Box Whisker Plots in just minutes.
Download a free 30-day trial. Get Box Whisker Plots now!
Learn More...
- Box and Whisker Plot case study example
- Compare QI Macros box plots to others
- How to label the median on a Box and Whisker Plot
QI Macros Draws These Charts Too!
