Wonder why some control limits are flat and others are wavy?
The answer: constant versus varying sample sizes.
- Control charts with constant sample sizes (c, np, XmR charts) have flat control limit lines.
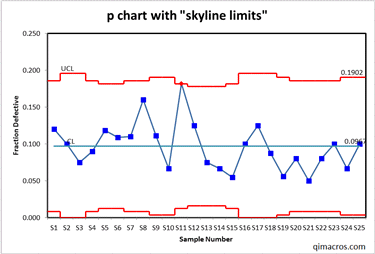
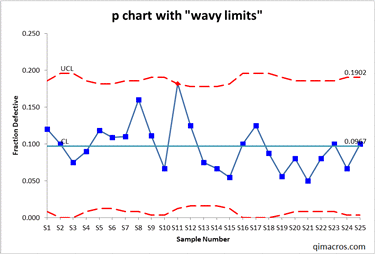
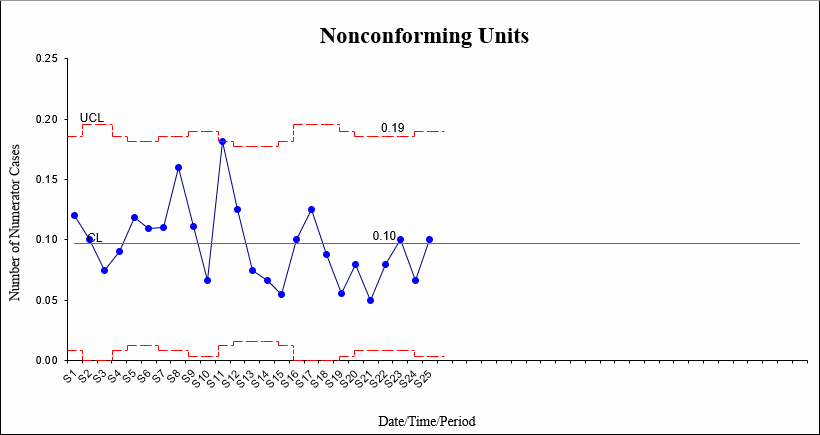
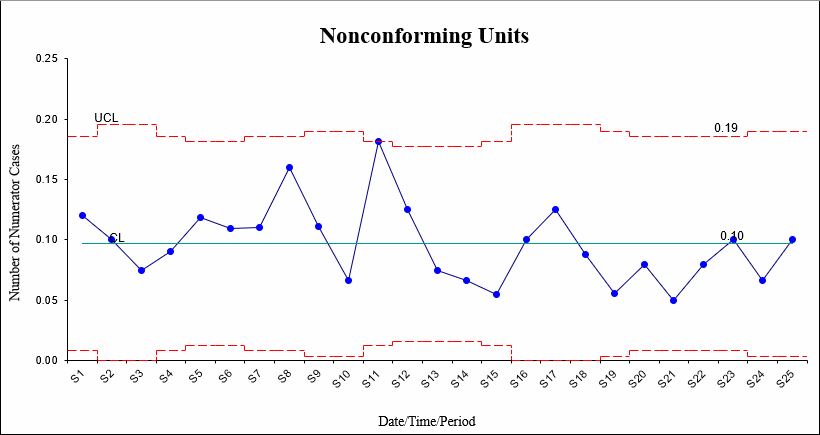
- Control charts with varying sample sizes (p, u, XbarR and XandS charts), have control limit lines that vary. These are either displayed as wavy or skyline lines.
QI Macros provides both options for displaying varying control limits.
Skyline Limits (default)
Wavy Limits
To Change the Format on One Chart:
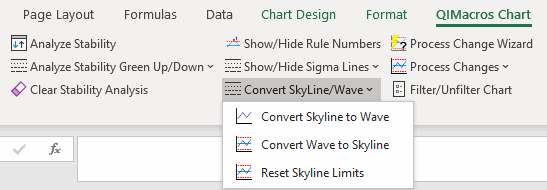
- Click on your chart, then click on the QI Macros chart menu and select the Convert SkyLine/Wave drop-down menu. You can then select either "Convert Skyline to Wave" or vice versa:
 '
' - QI Macros will change the control limits to the new format.
Yes - it's that easy!
To change the QI Macros default from skyline limits to wavy limits:
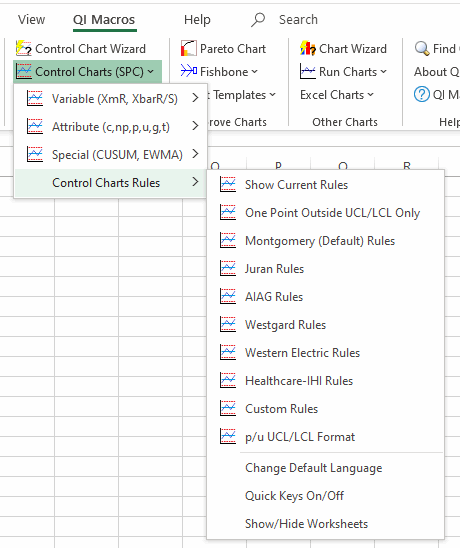
Click on Control Charts, then Control Chart Rules, then p/u UCL/LCL format.
That's it. Now all of the p, u, XbarR and XbarS charts you run will have wavy limits.
Reset Skyline Limits
If you have unfiltered data in a template that has Skyline or Wavy Limits, you can filter your data set by selecting your chart:
Next, choose QIMacros Chart > Convert Skyline/Wave > Reset Skyline Limits:
Your data set will now be filtered:
Stop Struggling with Control Charts!
Start creating your Control Charts in just minutes.
Download a free 30-day trial. Get Control Charts now!
QI Macros Draws These Charts Too!
