Struggling to Create EWMA Charts in Excel?
QI Macros can create them for you in seconds!
Draw an EWMA Chart using QI Macros:
- Select your data.
- Click on QI Macros menu > Control Charts (SPC) > Special> EWMA.
- QI Macros will do the math and draw the graph for you.
Why it Matters:
Use the EWMA Chart when you have one sample and want to detect small shifts in performance. In addition to an EWMA (exponentially weighted moving average) chart, you might consider a Cusum chart.
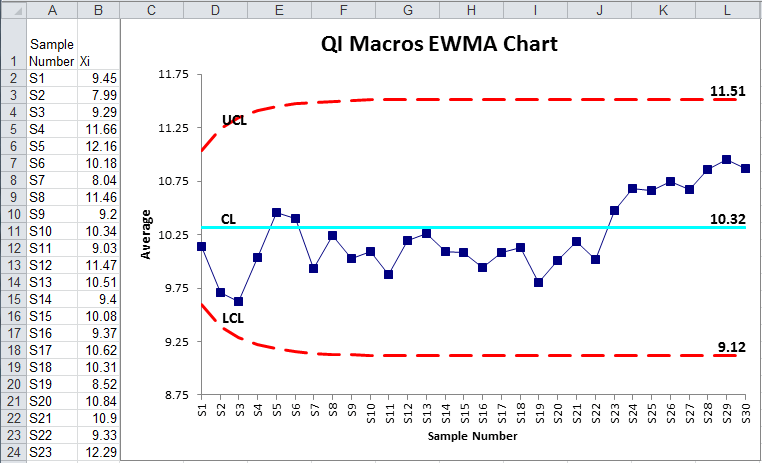
Example of an EWMA Chart created in QI Macros for Excel
QI Macros also contains a ready made EWMA chart template.
To create an EWMA control chart using QI Macros:
- Highlight your data and select "EWMA" from the "Control Charts (SPC)" drop-down menu.
- Next you will be prompted to either accept the default alpha parameter of 0.2 or enter in your own:
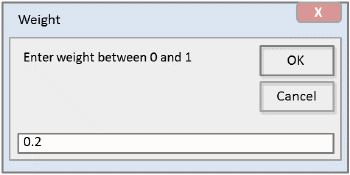
- QI Macros does the rest.
Note: Per Montgomery 4th Edition, “values of λ in the interval 0.05 ≤ λ ≤ 0.2 work well in practice, with λ = 0.05, λ = 0.10, and λ = 0.20 being popular choices. A good rule of thumb is to use smaller values of λ to detect smaller shifts."
The lower the value of the alpha parameter, the closer your UCL and LCL will be to the CL; and vice versa.
Stop Struggling with EWMA Charts!
Start creating your EWMA Charts in just minutes.
Download a free 30-day trial. Get EWMA Charts now!
QI Macros Draws These Charts Too!
