Want to Do Regression Analysis in Excel?
QI Macros can do it for you!
Run Regression Analysis using QI Macros
- Select your data.
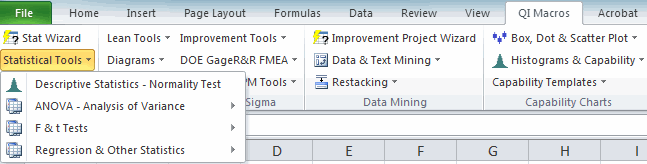
- Click on QI Macros menu > Statistical Tools > Regression.
- QI Macros will do the math and analysis for you.
You Don't Have to be a Expert to Run Regression Analysis!
The purpose of regression analysis is to evaluate the effects of one or more independent variables on a single dependent variable. Regression arrives at an equation to predict performance based on each of the inputs.
Regression Analysis Example
What if we wanted to know if the salt concentration in runoff (dependent variable) is related to the percent of paved roadway area (independent variable).
This sample data is found in QI Macros Test Data > statistical.xlsx > Regression Data:
- Enter your data into Excel with the independent variable in the left column and the dependent variable in the right column.
- Next, select your data and click on QI Macros > Statistical Tools > Regression & Other Statistics > Regression:
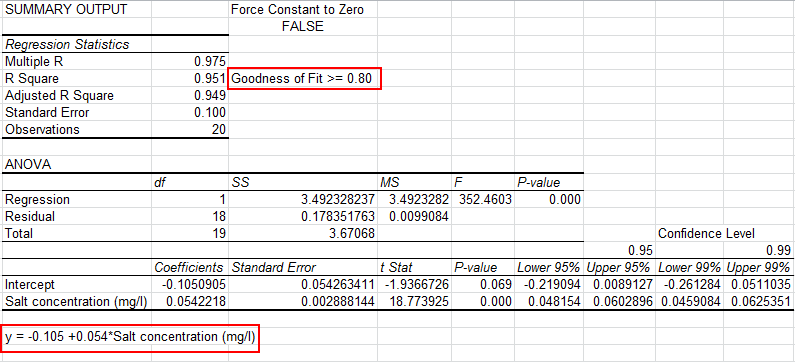
- QI Macros will automatically perform the regression analysis calculations for you:
NOTE: If the first cell of your y values column is blank, that column of data will be omitted from your Regression output.
Evaluate the R Square value (0.951)
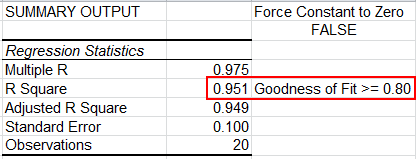
Analysis: If R Square is greater than 0.80, as it is in this case, there is a good fit to the data. Some statistics references recommend using the Adjusted R Square value.
Interpretation: R Square of .951 means that 95.1% of the variation in salt concentration can be explained by roadway area. The adjusted R Square of .949 means 94.9%.
Evaluate the p Value
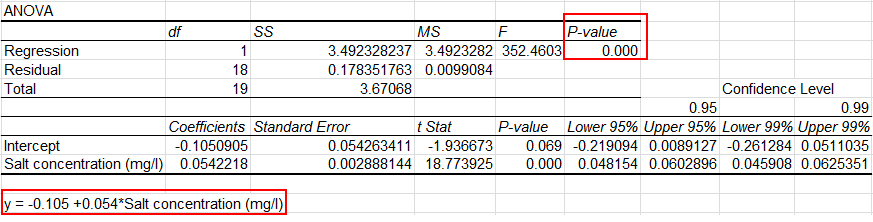
Since the p value ( 0 < 0.05), we "Reject the Null Hypothesis" that the two variables are unrelated. In other words, there is a relation between the two variables.
Use the Equation for Prediction and Estimation
Using the equation, y = Salt concentration = 2.677 + 17.547*(% paved roadway area), you could predict the salt concentration based on the percent of paved roadway. For example, if the % of paved roadway = 1% the Salt concentration could be estimated as 17.547* (1%) +2.6765 = 20.2235 mg/l.
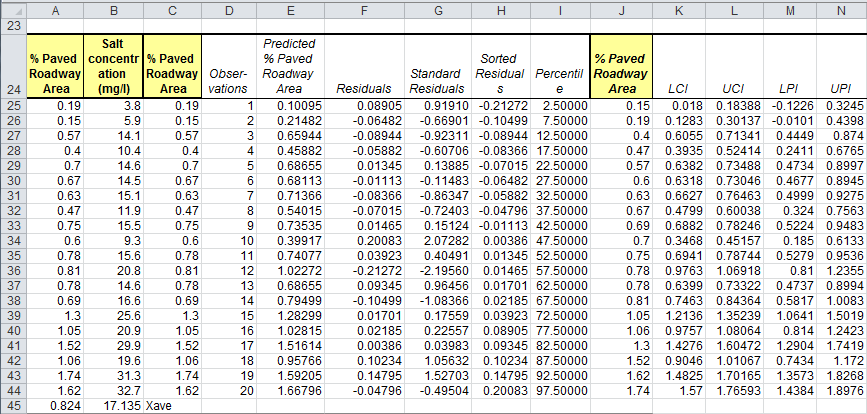
Residuals Output, Probability Output and Charts
In addition to the Summary Output above, QI Macros also calculates Residuals and Probability Data and creates scatter plots in Excel for you:
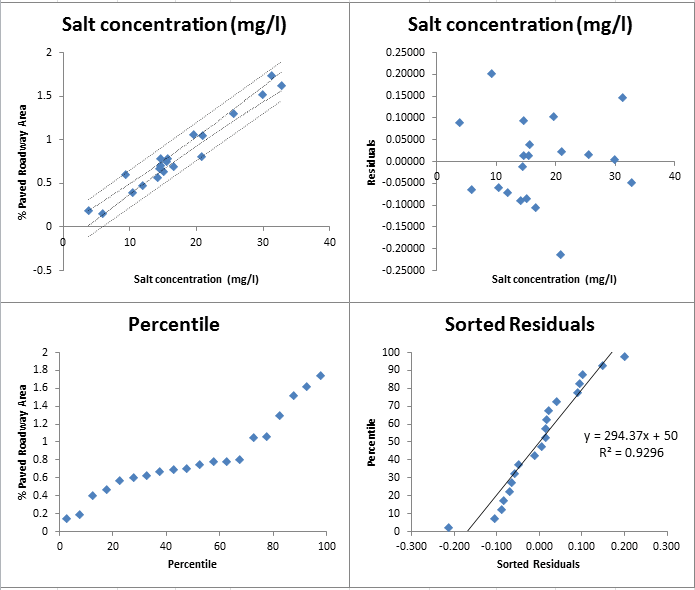
NOTE: The straight lines found in your first chart (Salt concentration) represent the Upper and Lower Prediction Intervals, while the more curved lines are the Upper and Lower Confidence Intervals
Confidence Intervals provide a view into the uncertainty when estimating the mean, while Prediction Intervals account for variation in the Y values around the mean.
The 95% and 99% Confidence Levels reference when your alpha value is set at .05 (95%) or .01 (99%). This provides you with information on how the confidence level can impact your results, depending on where alpha is set.
QI Macros also performs Multiple Regression Analysis and Binary Logistic Regression Analysis.
