Trying to Do a Levene's Test in Excel?
QI Macros can run a Levene's test for you in seconds!
Run a Levene's Test of Variance using QI Macros
- Select your data.
- Click on QI Macros menu > Statistical Tools > F & t Tests > Levenes Test.
- QI Macros will do the math and analysis for you.
Levene's Test for Non-Normal Data and More Than Two Data Samples
Levene's Test compares two or more independent sets of test data. It helps determine if the variances are the same or different from each other. The Levene's Test is like the f test. However, the Levene's test is robust enough for non-normal data and handles more than two columns of data. QI Macros uses Median (Brown-Forsythe modification) instead of the Mean for calculations.
Variance is the measurement of the spread between numbers in a data set.
Note: Excel does not do a Levene's Test. QI Macros adds this functionality.
Levene's Test Example using QI Macros
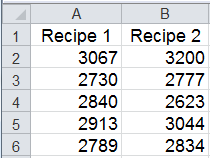
If you're producing rubber made with two different recipes, you might want to know if the variances in tensile strengths are the same or different (Juran's QC Handbook 4th pg 23.74):
- Conduct a test and enter the data into Excel.
- Click and drag over the data to select it and click on QI Macros Menu, Statistical Tools, f and t Tests and then Levene's test for variance.
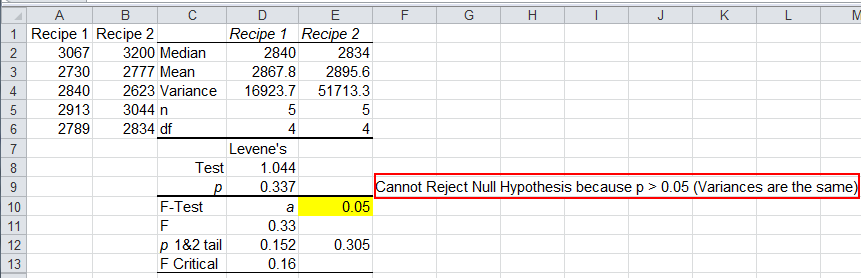
- QI Macros will perform the calculations and interpret the results for you.
Interpreting the Levene's Test Results Manually
- The null hypothesis (H0) - variances are the same
- The alternate hypothesis (Ha) - variances are not the same
Hypothesis Test |
Compare |
Result |
| p value Method | p value < a | Reject the null hypothesis (variances are not the same) |
| p value Method | p value > a | Cannot Reject the null hypothesis (variances are the same) |
In the example above, since the p value > a ( 0.337> 0.05), we cannot reject the null hypothesis (variances are the same).
While an F test works well on two-samples of normal data, it isn't robust enough to handle non-normal data or more than two samples. (Notice that Levene's p value differs from F Test's two-tailed value of 0.305; however both cause acceptance of null hypothesis.)
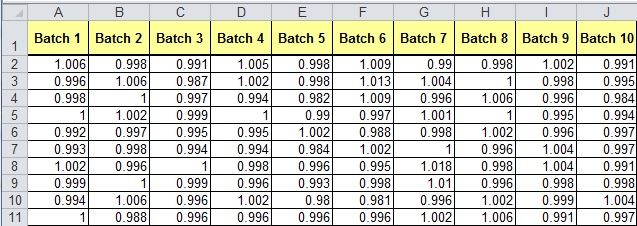
Levene's Test - ten sample example
Now, consider the following example of ten batches of gear diameters:
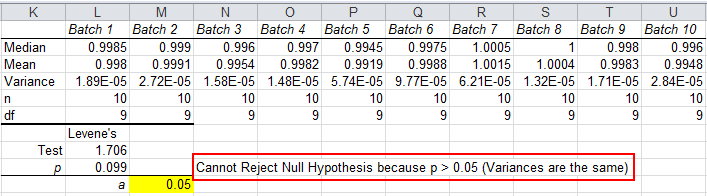
Again the p-value 0.099 > 0.05, so we cannot reject the null hypothesis (accept the null hypothesis). Variances are the same from batch to batch.
